Bitcoin and Ethereum price prediction for today: BTC/USD, ETH/USD long above $7668 and $570 respectively
- This might be the best time of the year to buy Cryptos, if only we know when to sell them without hesitation
- Main Cryptocurrencies are showing ending patterns with high chances of bullish swings

The technical analysis today is very specific. There is a clear buying opportunity in the main Cryptocurrencies, with the lowest prices since February and a stop very-well defined. Position-taking should be accompanied by the commitment to close every position if the stops are triggered.
BTC/USD 1H chart
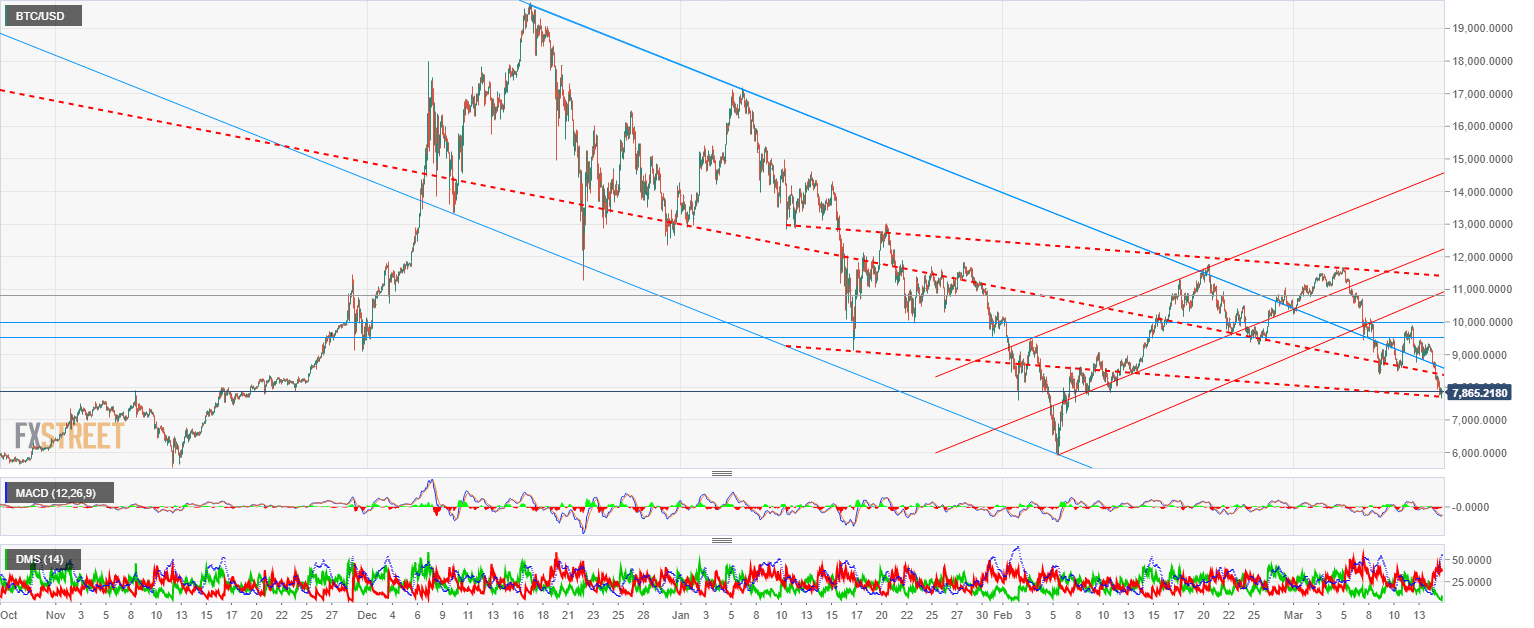
Bitcoin price is trading during the European morning around $7865, leaving the low for the current movement at $7668. We still can't validate this price as the reference to establish a clear stop, so it's better to give some room to our stop, placing it just below $7500. The potential benefits are advantageous over the risk one should assume.
If the price confirms this scenario and starts a bullish movement, first resistance is at $8350, with next one located at $8600. The recovery of this level would confirm a change of scenario over to a bullish one.
MACD in the Bitcoin 1-hour chart is about to cross the trend signal. In the short term, the bullish configuration is certain.
Directional Movement Index shows a timid buying reaction just matching the base of the channel being hit, with a possible confirmation of the turning formation. While in the bearish leg, buyers have not increased and are showing a lateral profile. ADX is at high levels, responding to the bearish acceleration witnessed yesterday.
ETH/USD 1H chart
-636567117471701850.png)
Ethereum shows a similar situation, offering a good buying opportunity with a feasible stop. ETH/USD is trading around $610, over a 6% above today's lows in the Asian session, and right now any dip can be used as an entry point. We would place the stop just below February's lows, at $560. First resistance and confirmation of the current scenario is at $651.
MACD in the Ethereum 1-hour chart has crossed up cleanly. The indicator is currently in the initial steps of the move, so a confirmation test is probable and could take the price back to $590 to later go back to the bullish movement.
Directional Movement Index shows a lot more steam from buyers getting in the market, with a big pick up since 5:00 GMT. Sellers are losing strength, now trending clearly down.
Author

Tomas Salles
FXStreet
Tomàs Sallés was born in Barcelona in 1972, he is a certified technical analyst after having completing specialized courses in Spain and Switzerland.


