Bitcoin all-time high target remains as BTC price bounces back to $64K

Bitcoin (BTC $63,860.48) retargeted $64,000 on Oct. 1 after the BTC price monthly close set a new September record.
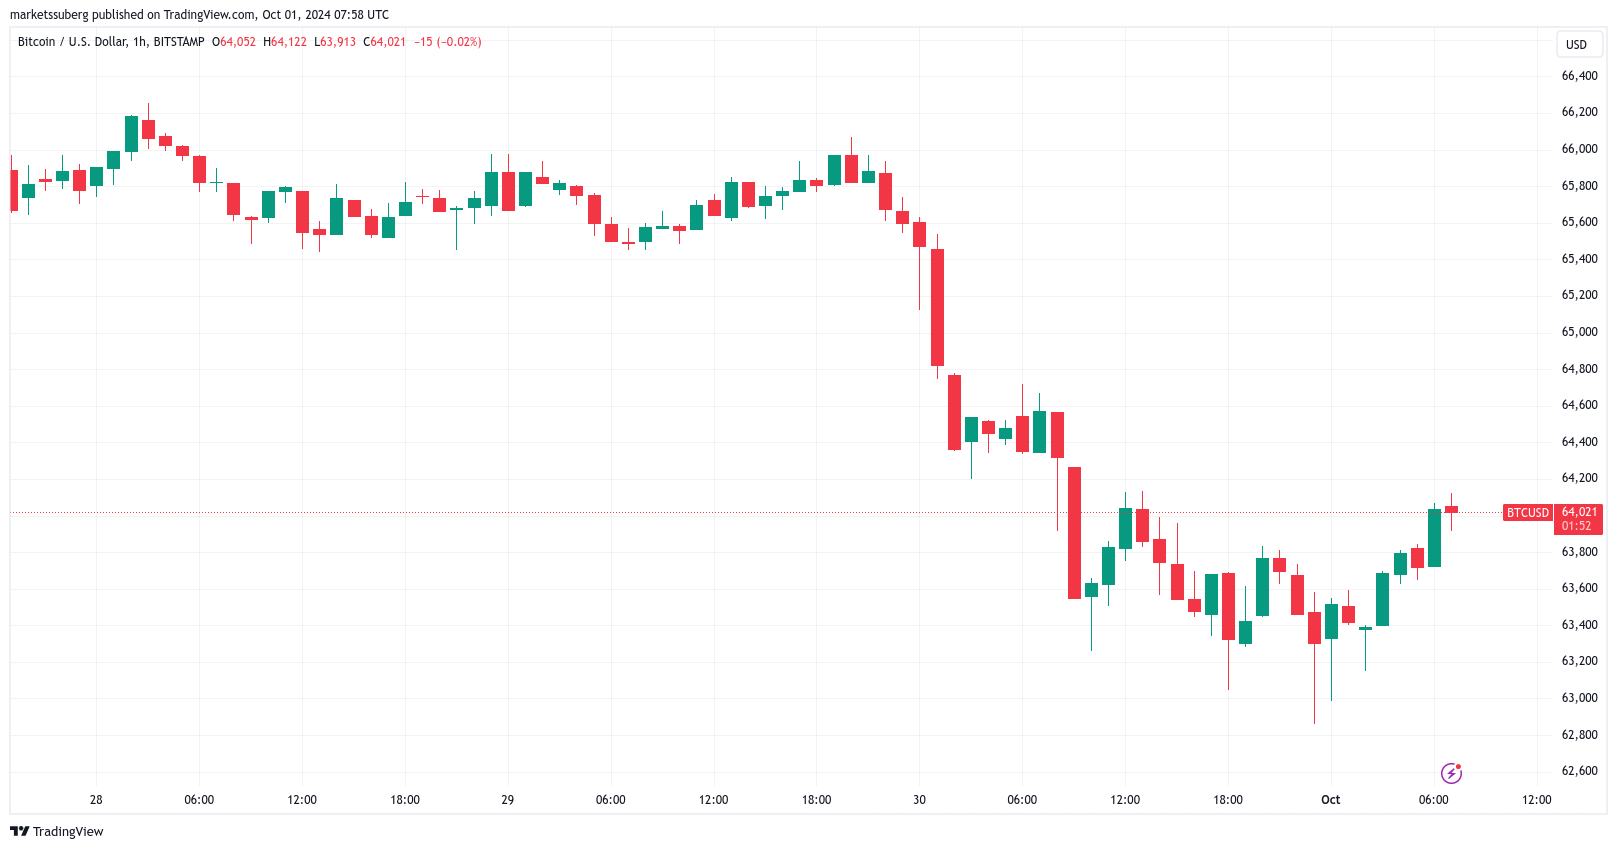
BTC/USD 1-hour chart. Source: TradingView
BTC price defies “Rektember” with 7% gains
Data from Cointelegraph Markets Pro and TradingView showed BTC/USD rebounding after a brief trip below the $63,000 mark.
Coming in at $63,300, the September monthly close sealed BTC price gains of 7.3%, per data from monitoring resource CoinGlass — Bitcoin’s best-ever ninth month of the year.
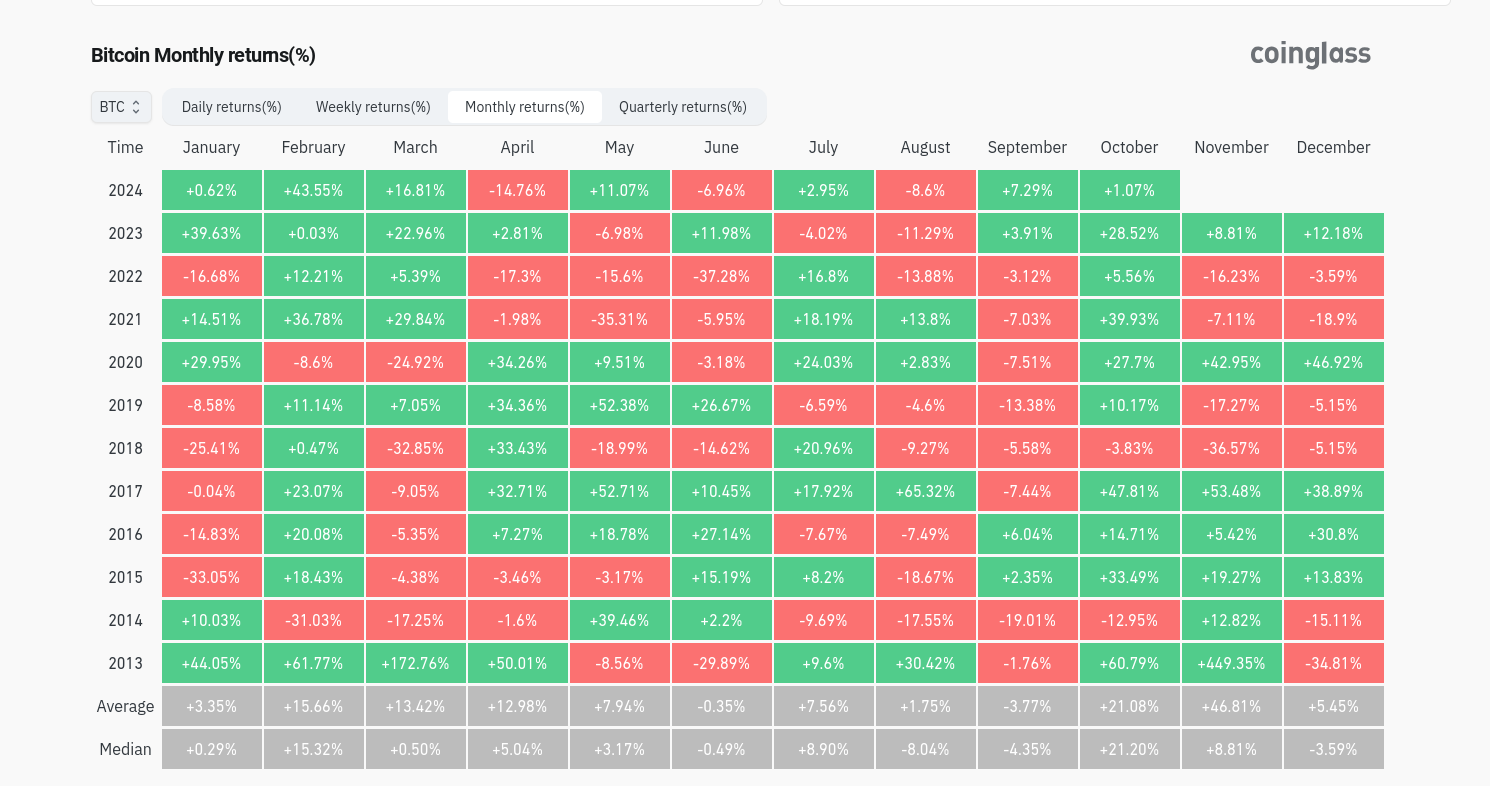
BTC/USD monthly returns (screenshot). Source: CoinGlass
While failing to flip $65,000 to support after hitting it last week, bulls nonetheless retained a key mid-term trend line in the form of the 21-week simple moving average (SMA).
According to Keith Alan, co-founder of trading resource Material Indicators, doing so was key to avoid “opening the door to a retest” of the range lows.
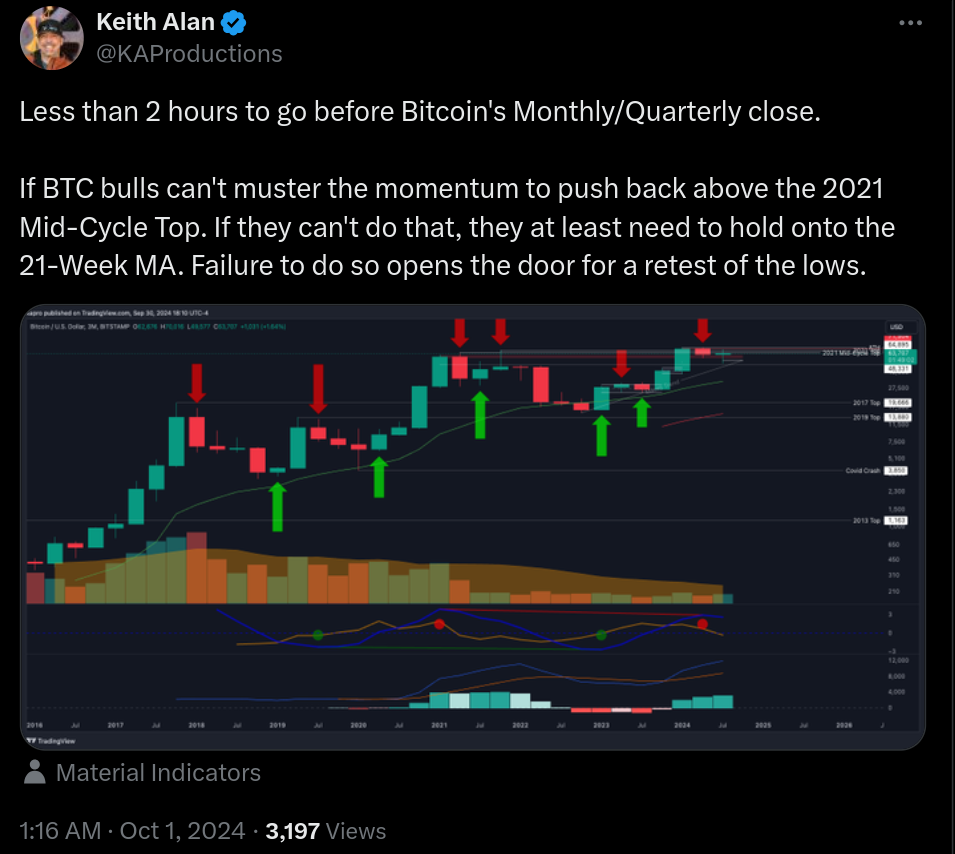
Source: Keith Alan
“Losing the 200-Day MA is not a good sign, but holding the 20-Week MA (for now) is. Losing them both would be a sign of weakness,” he said previously in a post on X.
Popular trader Daan Crypto Trades eyed changing order book liquidity, this stacking at $62,700 and $67,000, marking support and resistance levels, respectively.
“Testing the Daily 200 Moving Average after breaking above it yet another tiime,” he continued, agreeing with Alan.
So far this year it has struggled to hold on to that level. Whether $BTC trades above or below is a good mid/high timeframe momentum and strength indicator.
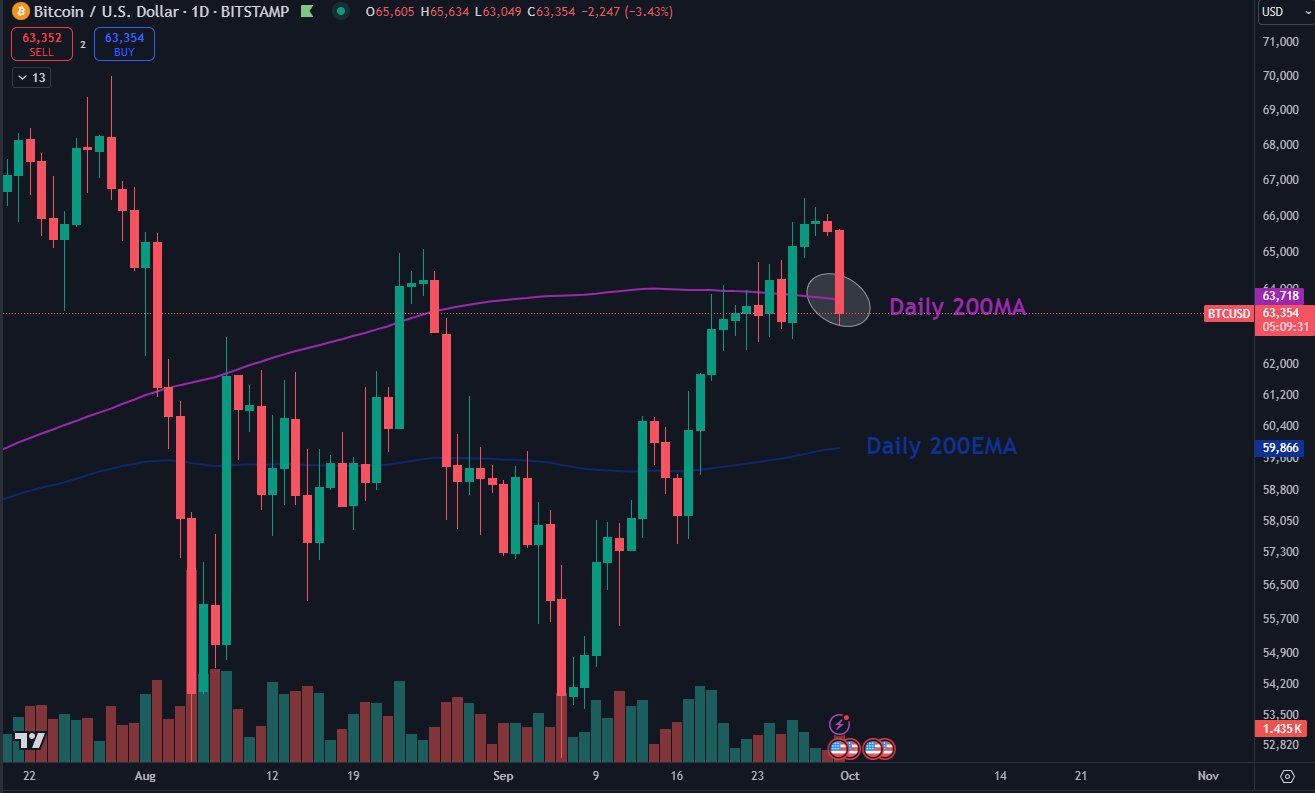
BTC/USD 1-day chart. Source: Daan Crypto Trades/X
On lower timeframes, fellow trader Roman was among those confident of upside continuation next.
“Some nice bull divs now forming on H4,” he told X followers, referring to a bullish divergence between price and the relative strength index (RSI) indicator.
As Cointelegraph reported, such scenarios often precede bullish BTC price performance.
“Expecting some upward movement /chop which will hopefully give us upwards consolidation instead of our 1D deviation,” Roman forecast.
Bitcoin dip-buying plans in full swing
Others suggested “buying the dip” as a suitable short-term strategy, despite progress so far fading beyond $65,000.
“Bitcoin officially made a higher high by closing above $65,000 — on the weekly as well,” trader, analyst and podcast host Scott Melker, known as “The Wolf of All Streets,” noted.
Now we look for dips to buy as it potentially establishes another higher low. Altcoins largely look the same, backtesting their own key breakout resistances as support.
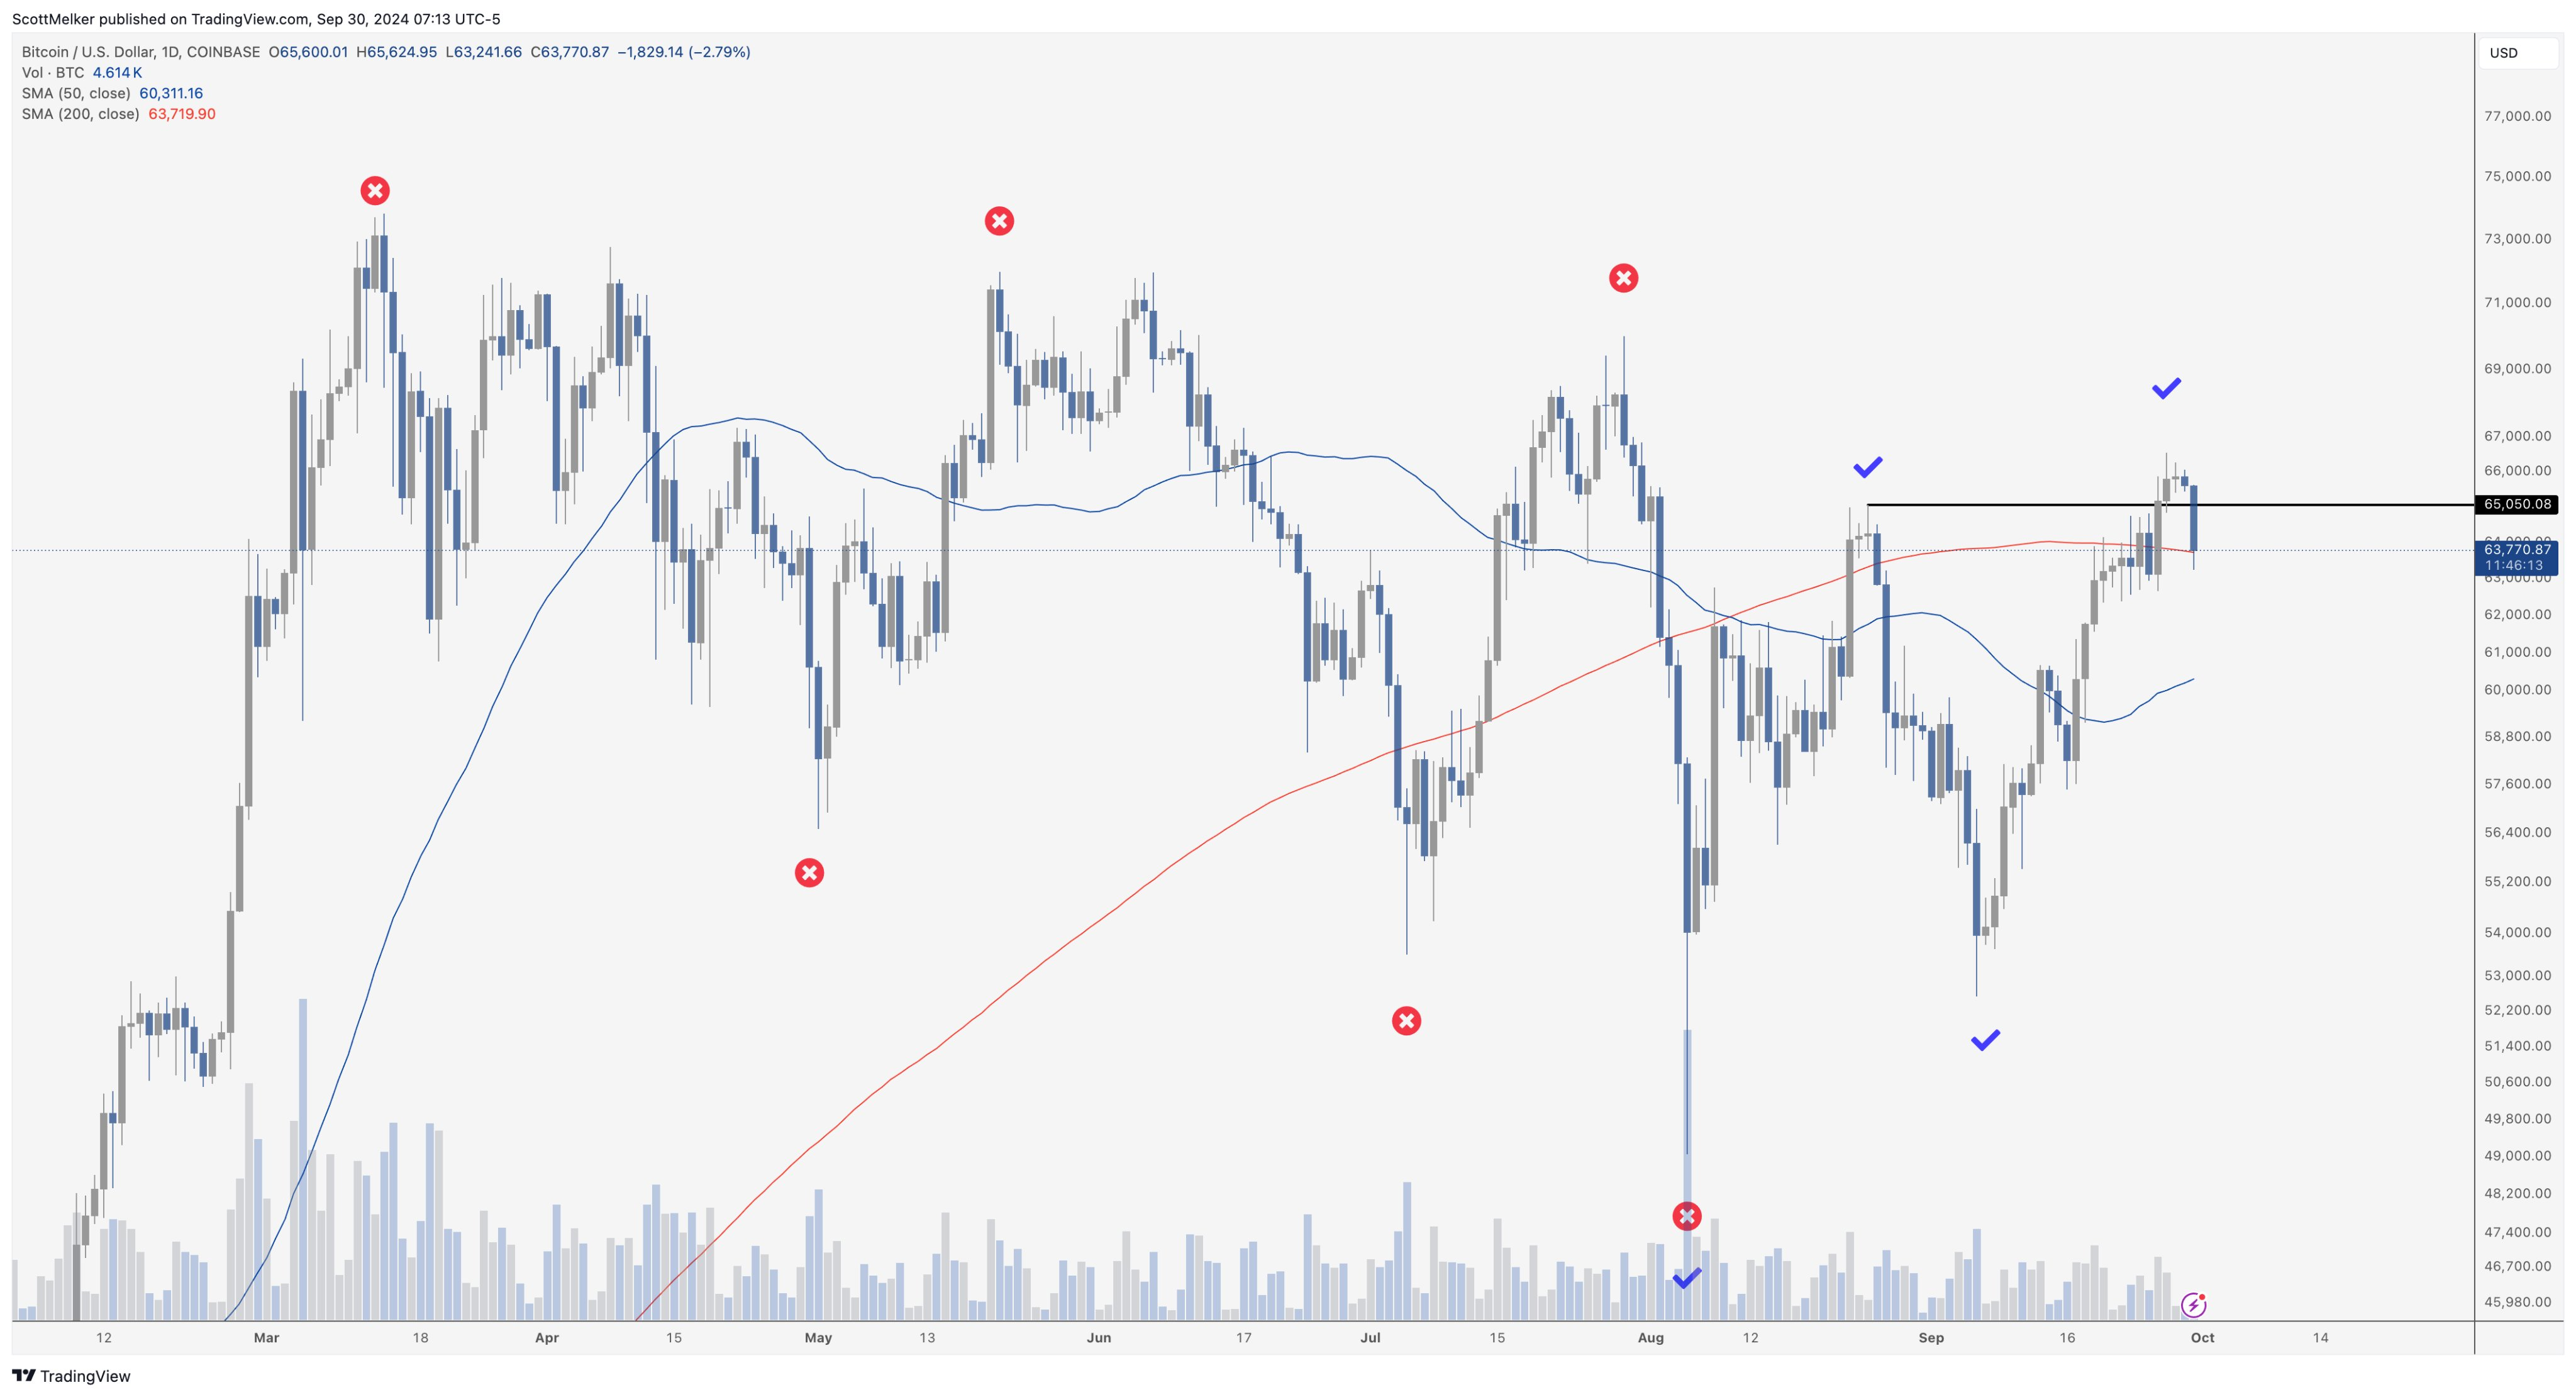
BTC/USD 1-day chart. Source: Scott Melker/X
Crypto trader, analyst and entrepreneur Michaël van de Poppe meanwhile doubled down on his plan for a new Bitcoin all-time high to come.
“Took the liquidity above the recent highs, and is coming back down,” part of an X post read before the monthly candle completed.
I think we're in a new uptrend, which means that dips are for buying. In that sense, if we get a retest at $60.5-61.3K, I'm interested before we test the ATH.
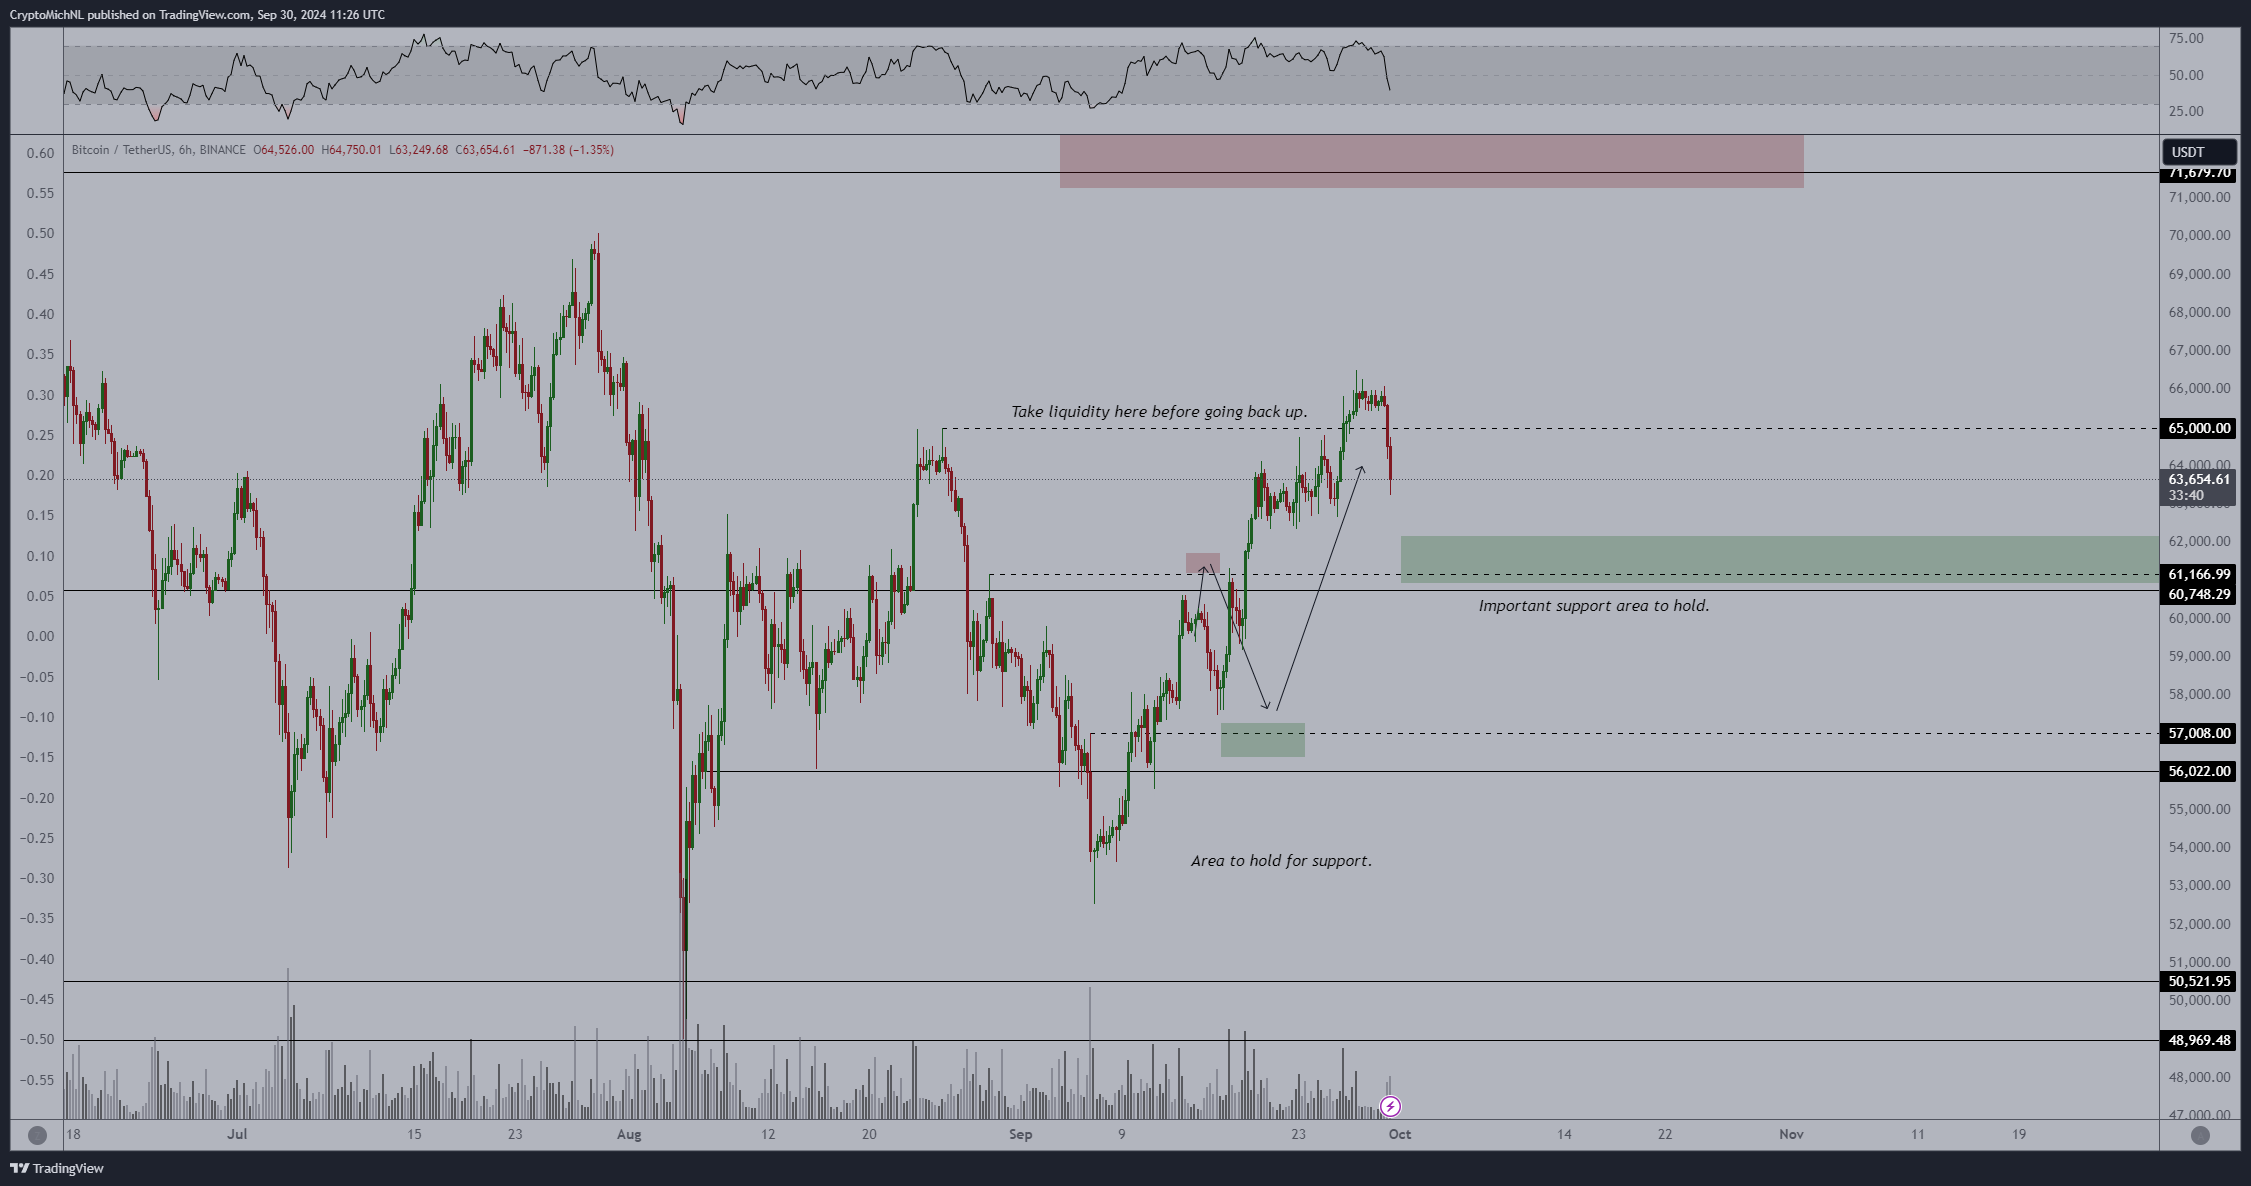
BTC/USDT 6-hour chart with RSI, volume data. Source: Michaël van de Poppe/X
Author

Cointelegraph Team
Cointelegraph
We are privileged enough to work with the best and brightest in Bitcoin.


