Binance Coin price snubs G-7 regulators, BNB targets 30% rally
- Binance Coin price is finalizing a minor ascending triangle pattern with a double-digit measured move.
- 200-day simple moving average (SMA) continues to be instructive as BNB consolidates.
- Binance Coin price trading flat since the FSA and FSC bold announcements regarding Binance Exchange.
Binance Coin price is nearing a pivotal point on the charts as BNB nears the apex of an ascending triangle pattern. Strong support along the 200-day SMA has been instrumental during the pattern development. If the cryptocurrency complex cooperates, the digital asset has the potential to rally beyond the 50-day SMA at $363.49.
Binance Coin price not discouraged, follows technicals
On Friday, Japan’s Financial Services Agency (FSA) announced that Binance exchange was not registered to do business in the country. The FSA had also warned Binance in March 2018.
On Saturday, UK’s Financial Conduct Authority (FCA) issued a “consumer warning” on Binance Markets Limited (BML) and the Binance Group, stating that “Binance Markets Limited is not permitted to undertake any regulated activity in the UK.” The action relates to Binance UK and will not affect British customers accessing the platform in other jurisdictions.
No exchange wants to have regulators interceding and negatively impacting business, but Binance Coin price has reacted calmly to the events. In fact, BNB is flat since the UK announcement, continuing the construction of an ascending triangle pattern.
The BNB ascending triangle pattern has formed since the June 22 low of $224.74, with the 200-day SMA providing upward guidance. The pattern is nearing the apex, indicating that a Binance Coin price breakout is near, or the pattern will be voided.
More specifically, once the price has crossed 80% of the distance between the base and the apex of the ascending triangle pattern, the probabilities of a successful breakout decline and the magnitude of any price move are diminished. Thus, Binance Coin price is at an inflection point in the pattern progression.
The BNB ascending triangle pattern’s measured move is 29%, presenting a target of $411.15. The rally would overcome the 50-day SMA at $363.40 and press Binance Coin price against the daily Ichimoku Cloud. However, the target is below the high of the right shoulder of a potential head-and-shoulders pattern at $434.05.
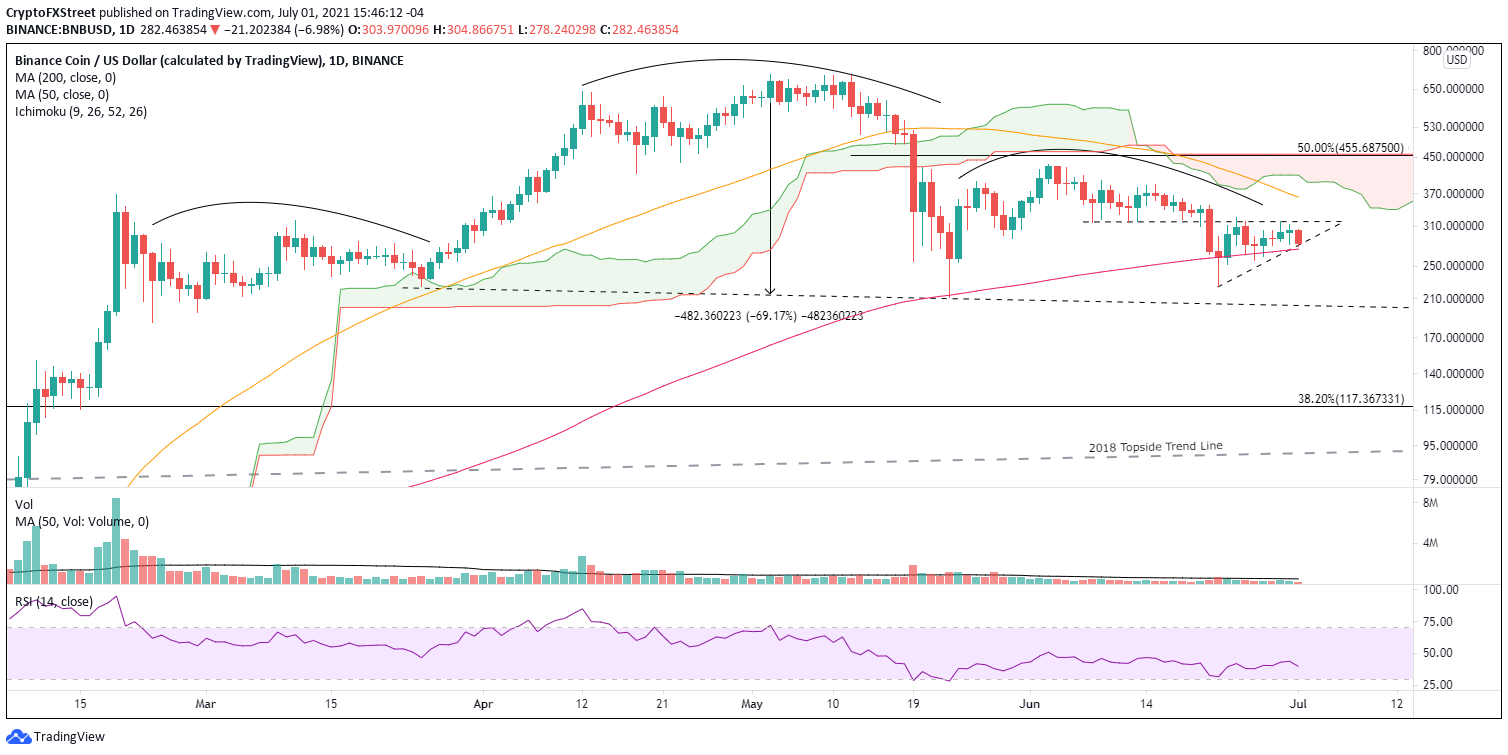
BNB/USD daily chart
Upward breakouts from ascending triangles occur around 77% of the time, so there is a 20% probability that Binance Coin price will release to the downside. A resolution to the downside would require a daily close below the strategically important 200-day SMA at $274.39. If the selling accelerates, BNB is primed to test the June 22 low of $224.74.
A decline to the measured move of 29% would target $199.90, overpowering the May 23 low of $210.95. Moreover, it would cross the neckline of the larger BNB head-and-shoulders pattern leaving Binance Coin price vulnerable to significant losses.
Author

Sheldon McIntyre, CMT
Independent Analyst
Sheldon has 24 years of investment experience holding various positions in companies based in the United States and Chile. His core competencies include BRIC and G-10 equity markets, swing and position trading and technical analysis.


