Binance Coin Price Prediction: BNB primed for a 30% rally if crypto market stabilizes
- Binance Coin price has shaped an outstanding head-and-shoulders topping pattern.
- BNB 200-day SMA was instructive support during this week’s spike lower.
- A strong close into Sunday would form a bullish hammer pattern on the weekly chart.

Binance Coin price is confronted with a bearish outlook as the right shoulder of the head-and-shoulders topping pattern may be near completion. The doji candlestick on June 22 did generate a reversal, but the resulting bounce was on marginal volume. Nevertheless, as long as BNB maintains daily closes above the 200-day simple moving average (SMA), the altcoin will be able to deflect any weakness in the cryptocurrency complex.
Binance Coin price still not secure, challenges remain
Binance Coin price plummeted 70% from the May 3 high of $704.62 to the May 23 low of $210.95, highlighted by a 34% decline on May 19. The performance was in line with most other altcoins, but unlike many cryptocurrencies, BNB held the 200-day SMA, a robust level of support to originate a meaningful rally.
With only the weight of the 50-day SMA pressing down on Binance Coin price, the digital token did not break the May 23 low during this recent sell-off in the cryptocurrency market. Moreover, BNB has maintained the 200-day SMA on a daily closing basis, establishing a level of relative strength.
If the cryptocurrency market does regain stability, Binance Coin price will not encounter any resistance until the 50-day SMA at $405.15. Then the high of the right shoulder at $434.05, delivering a 30% return for committed BNB investors. The trigger for timing the opportunity is a trade over $324.97.
After $434.05, Binance Coin price will not meet any formidable resistance until the all-time high of $704.62.

BNB/USD daily chart
On the bearish side, Binance Coin price remains locked in the right shoulder of a head-and-shoulders topping pattern, leaving it vulnerable to additional weakness, possibly triggering the neckline currently at $201.40. The BNB pattern will not be voided until a trade above the right shoulder high of $434.05.
The measured move of the head-and-shoulders pattern is 70%, indicating a final Binance Coin price low of $61.84, leaving BNB below the 50% retracement of the March 2020-May 2021 advance at $67.46.
An emerging concern for Binance Coin price is the triggering of a head-and-shoulders pattern for the BNB/BTC pair on June 21. The pair has rebounded back to the neckline and the 200 twelve-hour SMA, but the measured move for the pattern has still not been fulfilled. The target coincides with the May 23 low.
The BNB/BTC pair developments could signal that the Binance Coin price decline is not over yet, raising the importance of the neckline on the BNB chart.
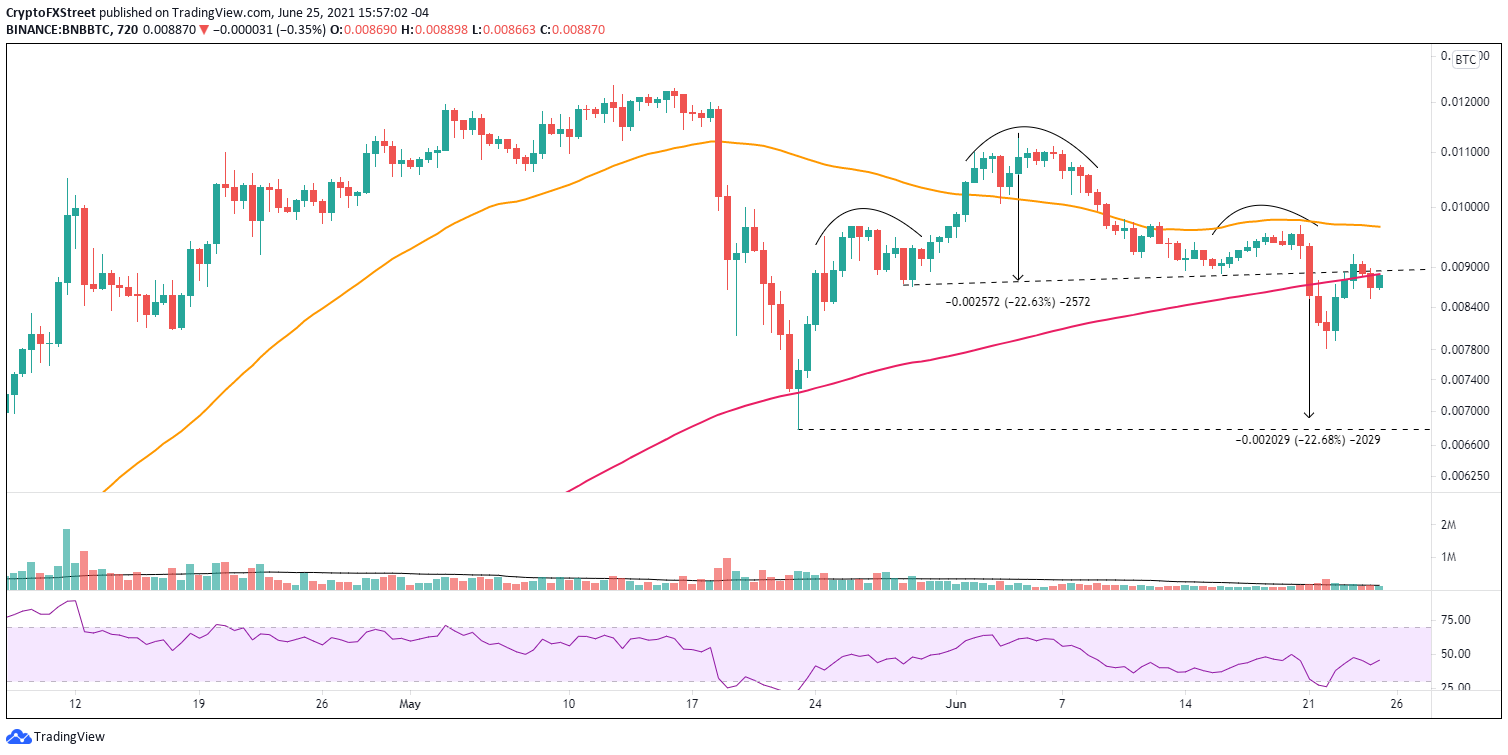
BNB/BTC 12-hour chart
Binance Coin price conditions are fluid right now as it deals with the crosscurrents of technical patterns and a grumpy cryptocurrency complex. The best approach is to wait for BNB to strike the pivots or support that will yield high probability opportunities.
Author

Sheldon McIntyre, CMT
Independent Analyst
Sheldon has 24 years of investment experience holding various positions in companies based in the United States and Chile. His core competencies include BRIC and G-10 equity markets, swing and position trading and technical analysis.



