Binance Coin Price Analysis: BNB poised for a 35% upswing
- Binance Coin price testing symmetrical triangle breakout during weak day.
- Daily Relative Strength Index (RSI) now displays a bearish momentum divergence.
- BNB market capitalization briefly crosses $100 billion milestone, joining Bitcoin and Ethereum.

Binance Coin price trend remains higher, despite today’s setback. On-chain data reflects a mixed opportunity in the digital token, suggesting marginal weakness in the coming days.
On-chain metrics support a brief consolidation or pullback
Yesterday, the Santiment MVRV ratio (30-day) peaked at 21.91%, reaching the lower level of the overbought band between 20% and 30%, extending back to April 2019. The reading is far from the extreme numbers recorded in February and April this year. Still, it alerted the possibility of some selling by long-term holders while Binance Coin price tagged an all-time high.
With the reading currently at 13.23%, there remains the potentiality for BNB price to consolidate further along the triangle’s upper trend line
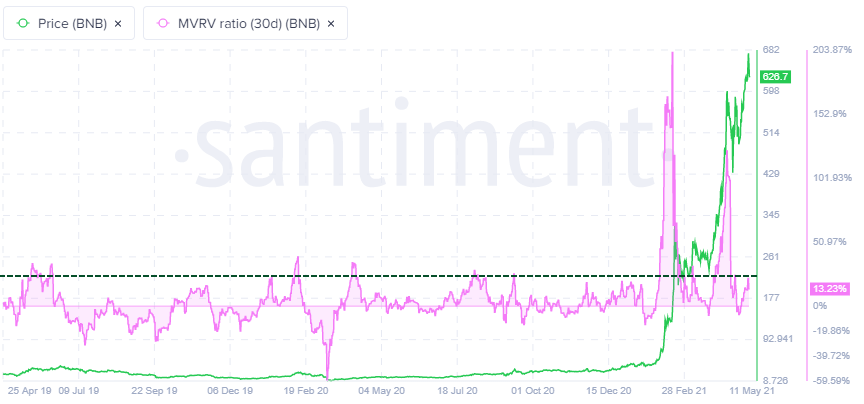
BNB MVRV (30-day) metric
The number of daily active addresses has fallen from a high of 313.4k on April 20 to 85.2k today, representing a 70% decline over the last two weeks. It is signifying a general exodus of speculators driven by profit-taking or simple reallocation of funds.
To be sure, the metric highlights a lack of addresses connecting to the BNB network, despite the fresh new highs, thereby dampening the price thrust at this point. However, the lack of speculator attention at this moment presents an untapped source for a surge in buying once they are compelled to chase the rally.
Overall, the daily active addresses may need some time to complete their bottom, putting weight on Binance Coin price in the near term.
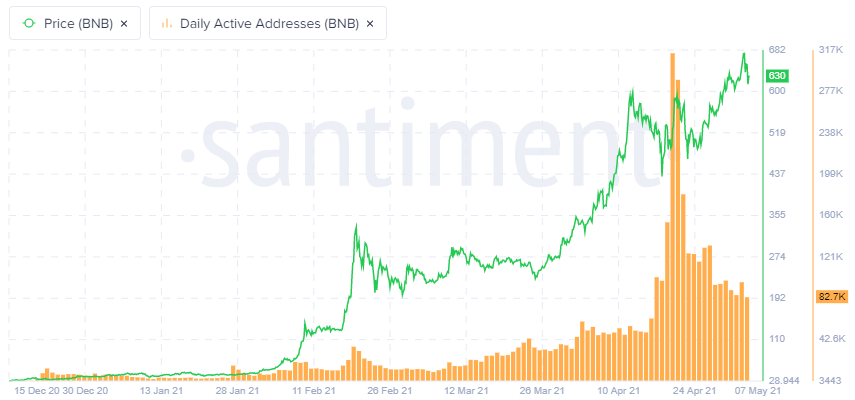
BNB daily active addresses
Binance Coin price missing the FOMO effect following breakout
Binance Coin price closed April with a 106% gain, making it the fourth-best monthly return since July 17 and the sixth consecutive positive month, while also printing an all-time high. It cannot be disputed, BNB is a leader in the cryptocurrency complex.
During the gyrations of the broad cryptocurrency complex, Binance Coin price outlined a symmetrical triangle pattern with a measured move target of just over 35%, targeting a price of $822.90 from the triangle’s upper trend line position on the April 29 breakout.
The target precedes the 161.8% Fibonacci extension of the April decline at $847.34. Big game hunters need to consider the 261.8% extension of the 2019-2020 bear market at $932.62 and the 261.8% extension of the February crash at $1,124.11 as potential targets for Binance Coin price.
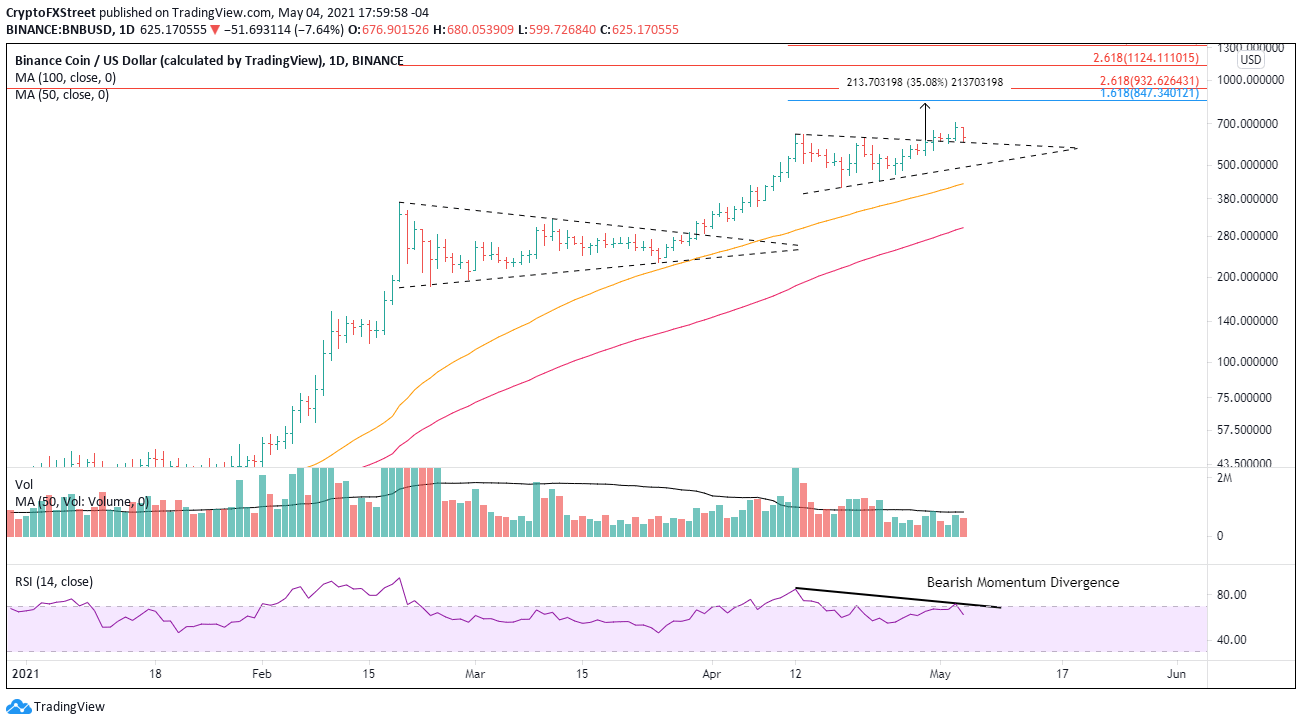
BNB/USD daily chart
A failure of the triangle breakout would flip attention around Binance Coin price to support, beginning with the triangle’s lower trend line at $487.00 and then the 50-day simple moving average (SMA) at $429.47.
Author

Sheldon McIntyre, CMT
Independent Analyst
Sheldon has 24 years of investment experience holding various positions in companies based in the United States and Chile. His core competencies include BRIC and G-10 equity markets, swing and position trading and technical analysis.



