Binance Elliott Wave technical analysis [Video]
![Binance Elliott Wave technical analysis [Video]](https://editorial.fxsstatic.com/images/i/Ondo-finance_Neutral.png)
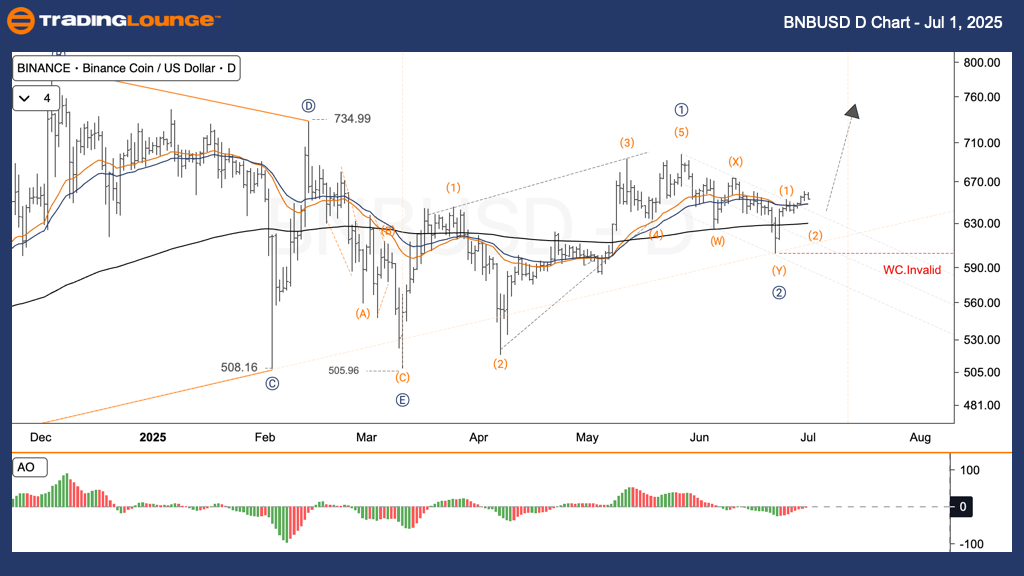
BNB/USD Elliott Wave technical analysis
Function: Follow Trend.
Mode: Motive.
Structure: Impulse.
Position: Wave 2.
Direction next higher degrees: Wave IV of Impulse.
Wave cancel invalid Level: $597.
BNB/USD trading strategy – Daily chart
Binance Coin (BNBUSD) is presenting a potential bullish reversal following a correction phase, likely marking the completion of wave ② near the Fibonacci retracement zone of 50% - 61.8%. This price area now hints at the start of a medium- to long-term advance into wave ③.
Trading strategies
-
Strategy:
-
For short-term traders (swing trade)
-
Watch for a price reversal near $633 to initiate a Long Position.
-
-
Risk management:
-
If the price dips below $597, the wave count becomes invalid and should be reviewed immediately.
-
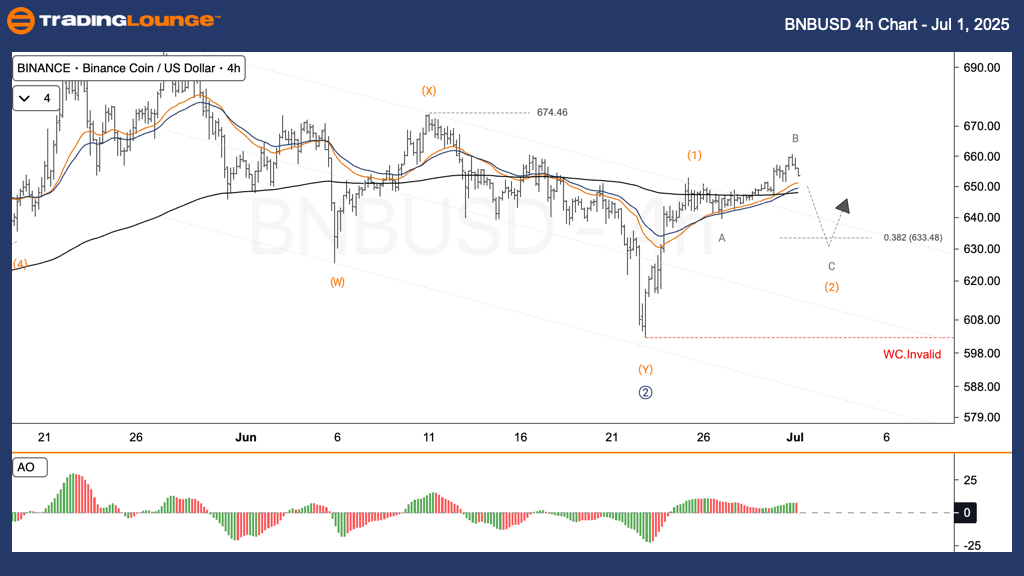
BNB/USD Elliott Wave technical analysis
Function: Follow Trend.
Mode: Motive.
Structure: Impulse.
Position: Wave 2.
Direction next higher degrees: Wave IV of Impulse.
Wave cancel invalid Level: $597.
BNB/USD trading strategy – Four-hour chart
The BNBUSD market structure suggests a probable end to wave ② within the Fibonacci 50% - 61.8% retracement area. The price action signals the beginning of wave ③, indicating a possible trend reversal in the medium term.
Trading strategies
-
Strategy:
-
For short-term traders (Swing trade)
-
A reversal near $633 offers a good opportunity to open a Long Position.
-
-
Risk management:
-
If the price breaks below $597, reassess the Elliott Wave count immediately.
-
Binance (BNB/USD) Elliott Wave technical analysis [Video]
Author

Peter Mathers
TradingLounge
Peter Mathers started actively trading in 1982. He began his career at Hoei and Shoin, a Japanese futures trading company.


