Ripple, Ethereum & Bitcoin: short-term analysis, April 20
- XRP/USD reaches our yesterday forecast of $0.864 during the Asian session.
- BTC/USD breaks the $8,400 level and $8,750 wait as the next resistance.

Ripple capitalizes the good prospects and surges with force. After the takeoff, it quickly got to $0.864, the resistance we mentioned yesterday, and has settled without breaking it. Above, it would find a price resistance congested zone with the psychological mark of $1.00.
Meanwhile, BTC/USD tested $8,400 again and managed to break it. Still, sales haven't appeared yet.
XRP/USD 240 min
Ripple is the main protagonist today, with a forceful upturn. The bullish reaction once it broke the wedge was very quick and it reached its first goal yesterday. Above $0.864, XRP/USD has room for an upwards development until a resistance at $0.958, followed by $1.203 and $1.084 at the range's roof.
Below, the strength of the rise has left few supports. The first one is at $0.74, followed by $0.67, where all the rise would be undone.
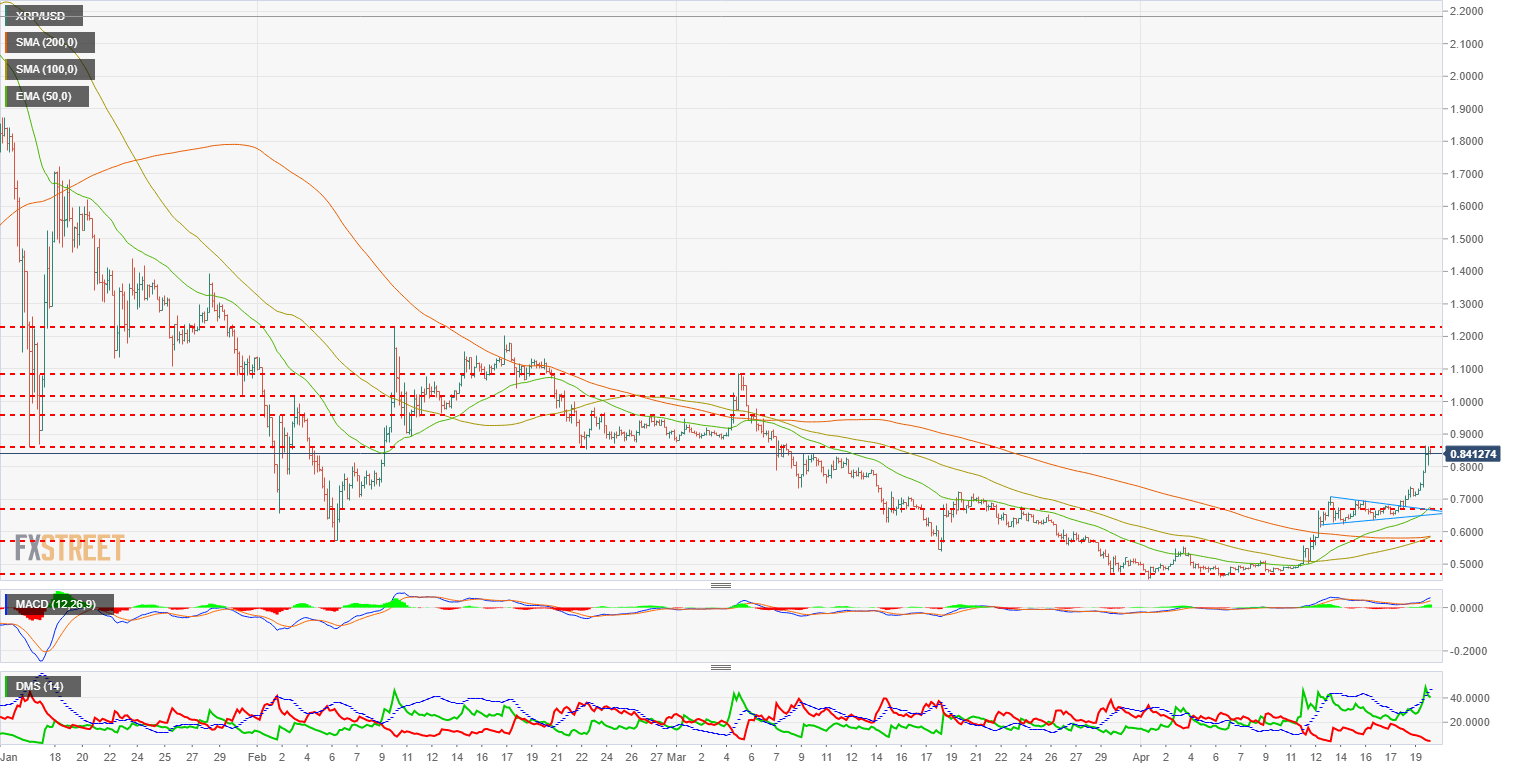
The 240 min. MACD has good slope and line and signal openness, favoring new rises without excluding some excess regulating retreats. Its tone is of bullish continuation.
The Directional Movement Index is conclusive in the sellers' complete retreat after the rise. Buyers have lost momentum too after reaching goals, but the ADX is still in strong trend levels, favoring more rises.
ETH/USD 240 min
Ethereum has behaved positively lately and has reached yesterday's second resistance at $576. In the early American session, it has already broken it, approaching the next goal at $625. Should it be broken too, the next objective would be around $675, where it would meet a trendline that sets the bearish channel's roof and is the key level to become fully bullish.
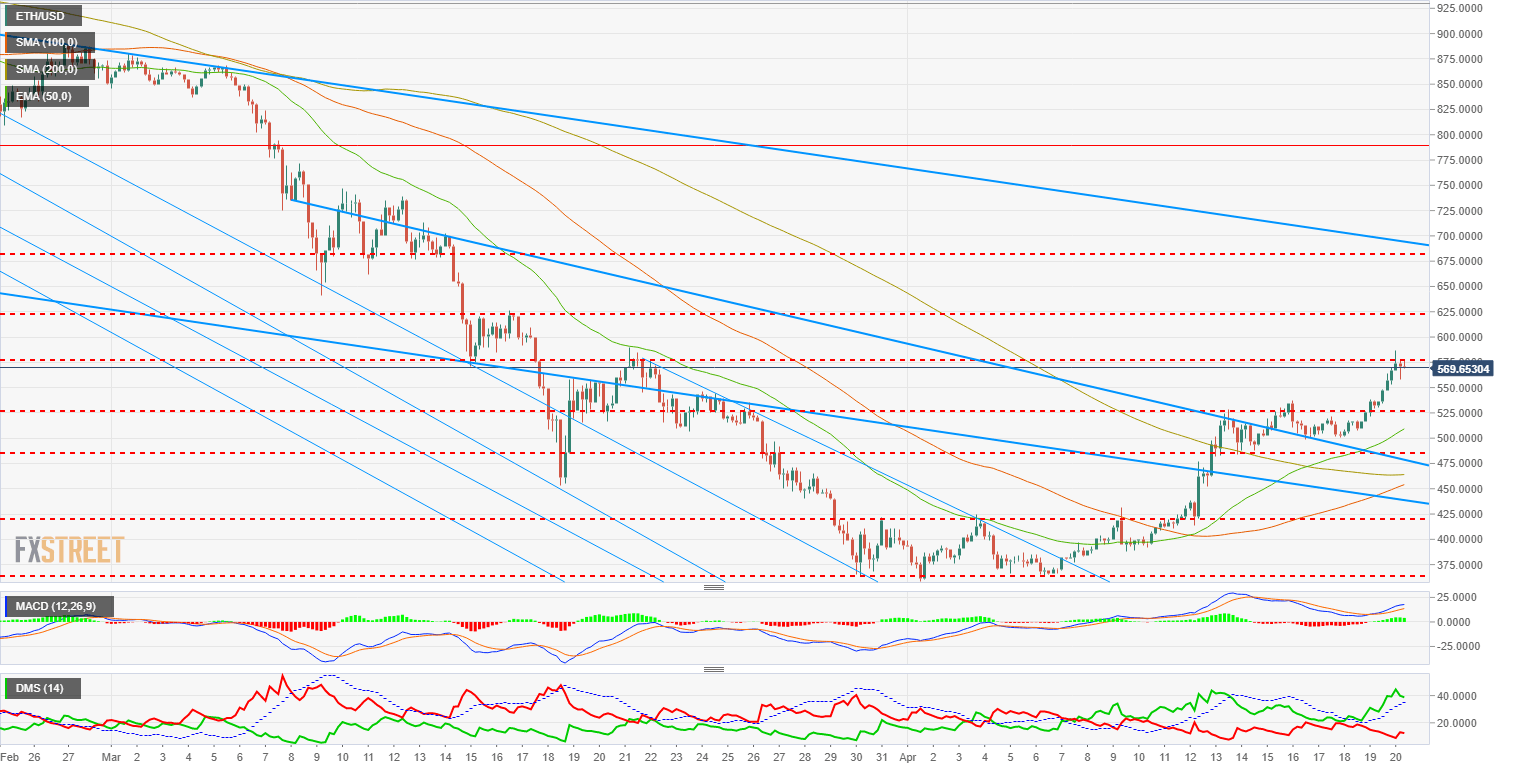
The 240 min MACD shows a possible divergent structure that could fade out if the price keeps rising consistently. A consolidation in the current levels is possible.
The Directional Movement Index favors more rises very clearly. Despite a sales upturn, buyers are likely to keep their current high level.
BTC/USD 240 min
Bitcoin has managed to break $8,400 at the expense of a momentum exhaustion. It is in a dense range of supports and resistances that hinders the trend continuity. Above that level, there are resistances at $8,750 and $9,000. Beyond, $9,500 are the main mid-term goal.
Below, there's the current range mid-level at $8,064, and its baseline at $7,800. The moving and exponential averages are within that range, so Bitcoin has many supports to rely on.

The MACD is very flat, in accordance with the price, and suggests lateral consolidation moves. The scenario is also favorable for a pattern that may increase the volatility to separate the indicators.
The Directional Movement Index shows buyers in a slim control. Sellers are at low levels and haven't appeared after reaching resistances, so the bearish hopes are in downtime. The ADX is below 20 and confirms the lack of tendency.
Author

Tomas Salles
FXStreet
Tomàs Sallés was born in Barcelona in 1972, he is a certified technical analyst after having completing specialized courses in Spain and Switzerland. He expanded his technical training following the guidance of great experts on the financial markets.




