Bearish clouds diminish as Chainlink price steps into a 32% northbound move
- Chainlink price validates a bullish breakout above a crucial falling trend line.
- Chainlink introduces a low-latency oracle solution for the DeFi derivatives market.
- Holding above the 100-day SMA support is necessary to continue the uptrend to $9.46.
-637336005550289133.jpg)
Chainlink price is back in the green after confirming support at $6.50. The price feed oracle token wiped out most gains accrued in September amid an unstoppable correction in October. With the price trading above a three-month-long trend line, LINK could quickly close the gap to $9.46.
Chainlink launches an oracle solution for the DeFi derivatives market
Chainlink has tapped into the growing DeFi (decentralized finance) market with its new “ultra-low latency pull-based price oracles—to enable and secure this immense on-chain market.” It anticipates the DeFi derivatives sector to continue growing in the future, and this development will revolutionize value creation among dApps (decentralized applications).
“We anticipate that a testable version of this new pull-based Chainlink oracle solution will be ready by the end of the year,” a related blog post said in part.
Chainlink has, over the years, established itself as the go-to platform for oracle-based price feeds. The protocol’s solutions are used across the crypto market, especially by smart contracts platforms.
This early entrance into the DeFi derivatives market is bound to give Chainlink an edge over its competitors while creating value for the network’s native token, LINK.
Chainlink price is on the move
Chainlink price holds above the 100-day EMA (Exponential Moving Average) (in blue), currently at $7.53. A break above a falling trend line catalyzed LINK price for a 32% bullish move to $9.46 – a profit target highlighted by the 200-day SMA (in purple).
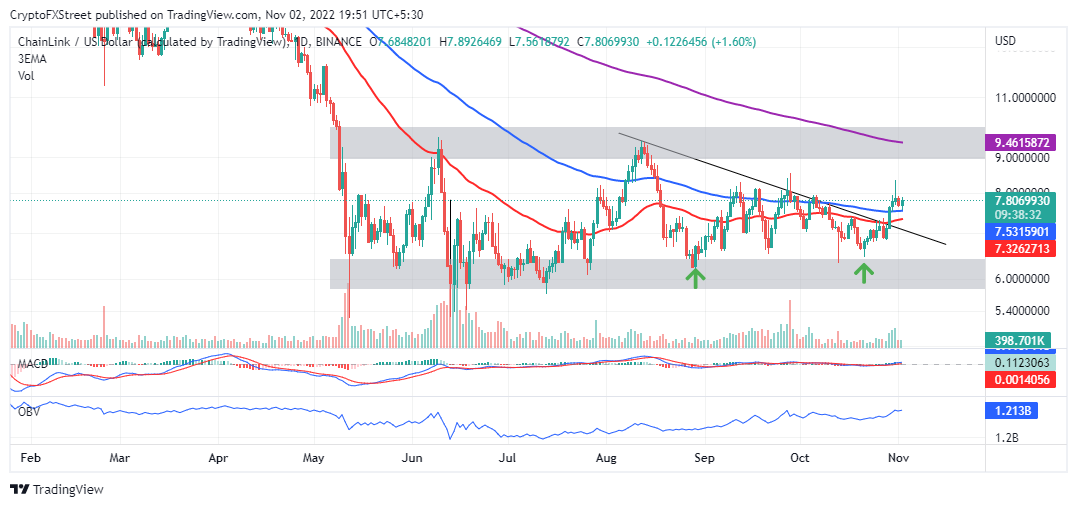
LINK/USD daily chart
LINK’s potential climb to $9.46 is supported by a buy signal from the MACD (Moving Average Convergence Divergence) indicator. A daily close above the 100-day coupled with the MACD holding above the mean line will probably add credibility to the Chainlink price bullish outlook.
On the other hand, shorting LINK could only prove profitable if bulls fail to break above the hurdle at $8.00. Trading below the 100-day EMA may confirm a bearish trend reversal, where Chainlink price could revisit lower support areas at $7.00, $6.50 and $6.00, respectively.
Author

John Isige
FXStreet
John Isige is a seasoned cryptocurrency journalist and markets analyst committed to delivering high-quality, actionable insights tailored to traders, investors, and crypto enthusiasts. He enjoys deep dives into emerging Web3 tren



