Band Protocol flashes strong buy signal following a massive 78% downturn
- BAND price is down 78% since its all-time high at $18.22 on August 10.
- The digital asset seems to have established a healthy support level at $4, and it's ready for a rebound.

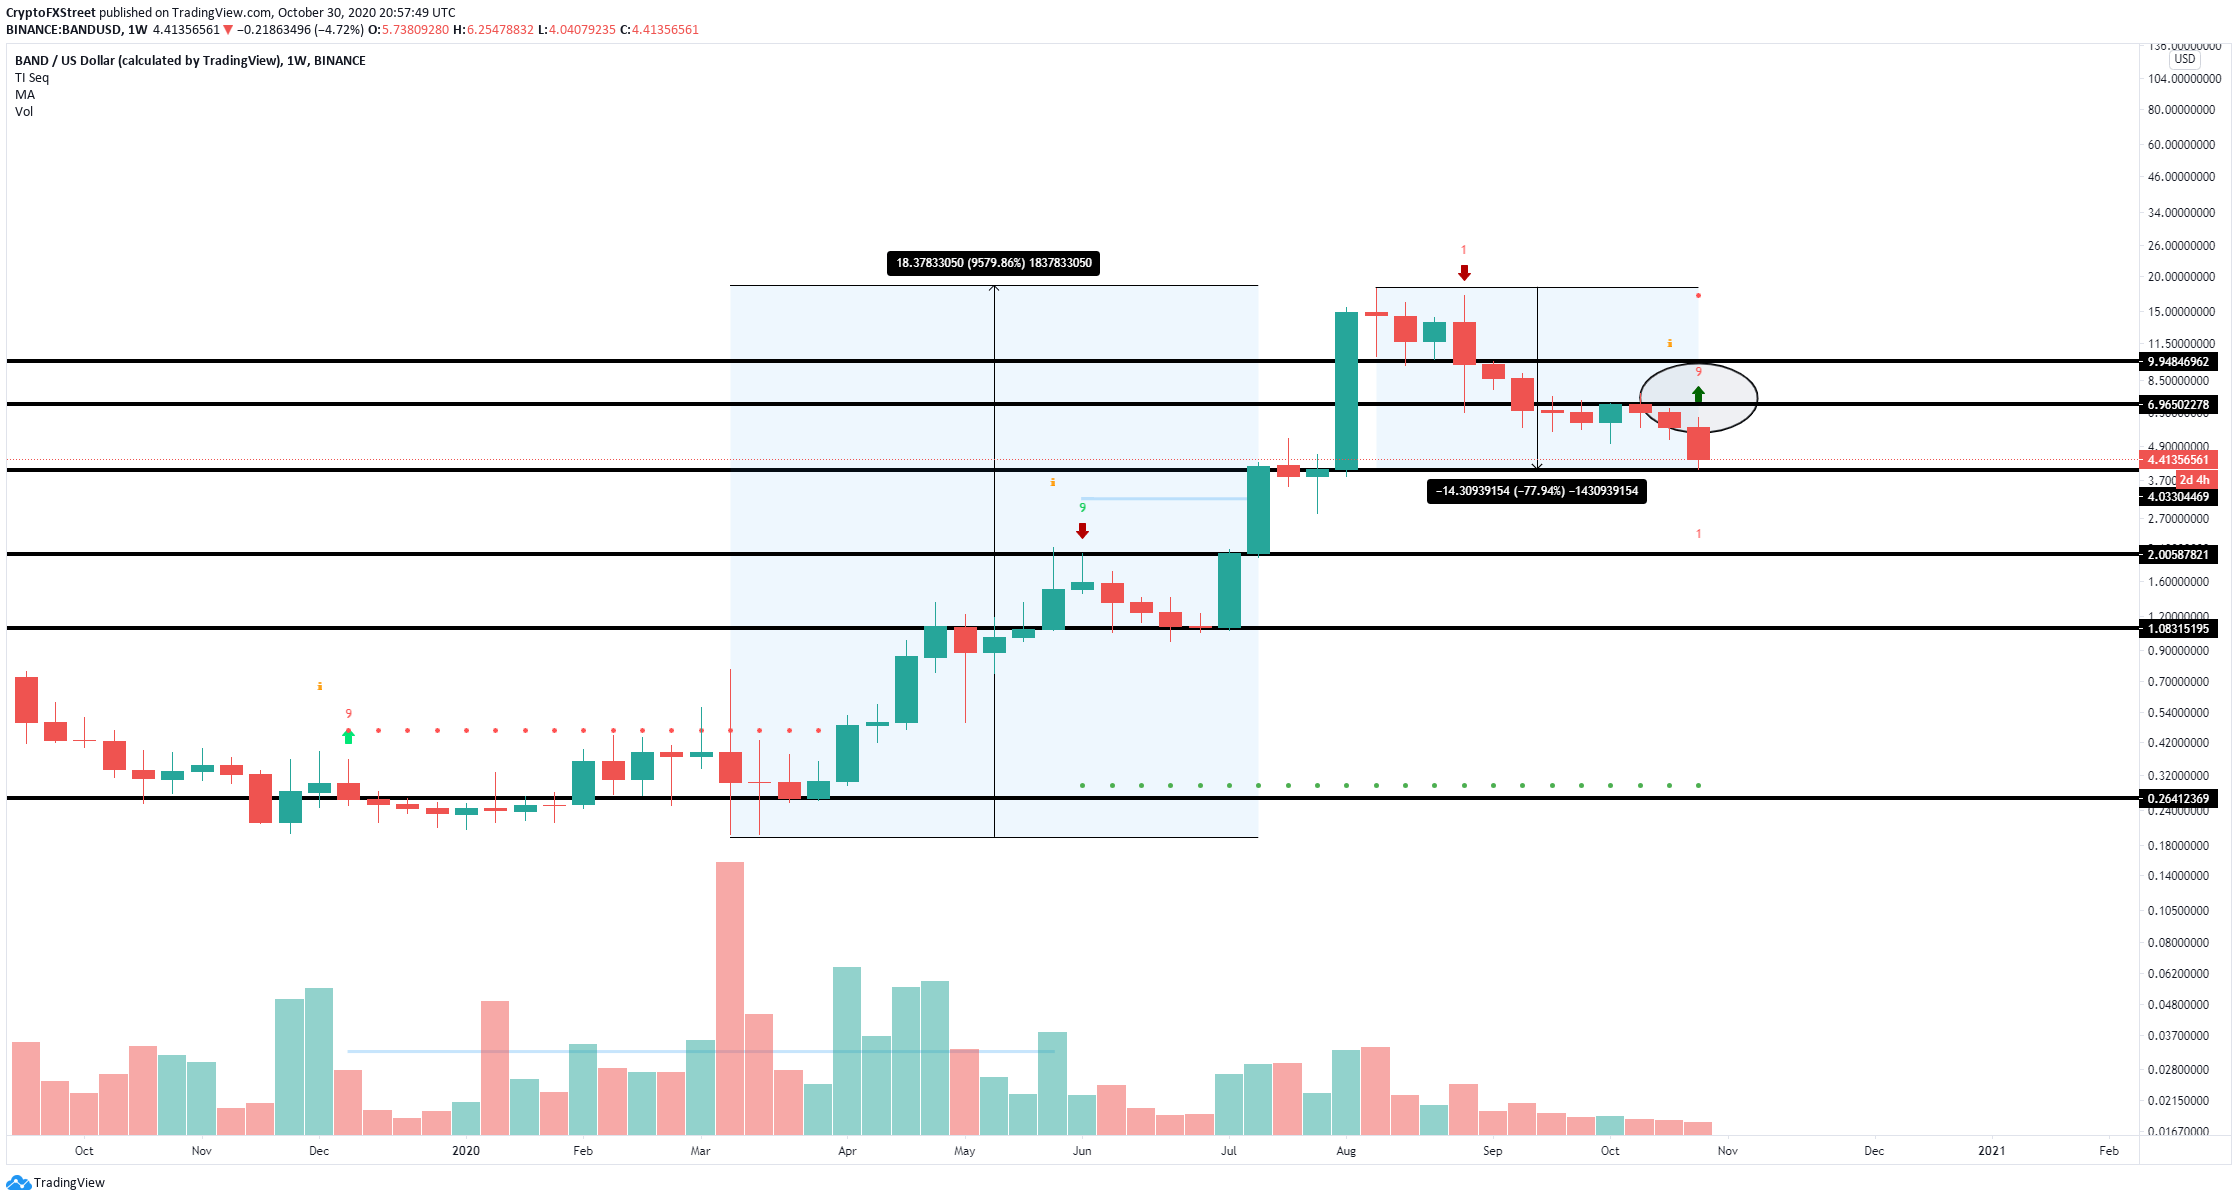
Band Protocol price had a colossal run from a low of $0.196 on March 9 to its all-time high at $18.22, a 9,500% increase in just six months. Of course, the pullback was extreme but expected considering the magnitude of the rally. The digital asset is now looking for a rebound after defending the psychological level at $4.
BAND eying up $10 if this critical support level holds
On the weekly chart, BAND's price stopped right at $4.04 and seems to be bouncing slightly, trading at $4.43 currently. The TD sequential indicator has presented a buy signal, which appears to confirm that $4 is a robust support level.
BAND/USD weekly chart
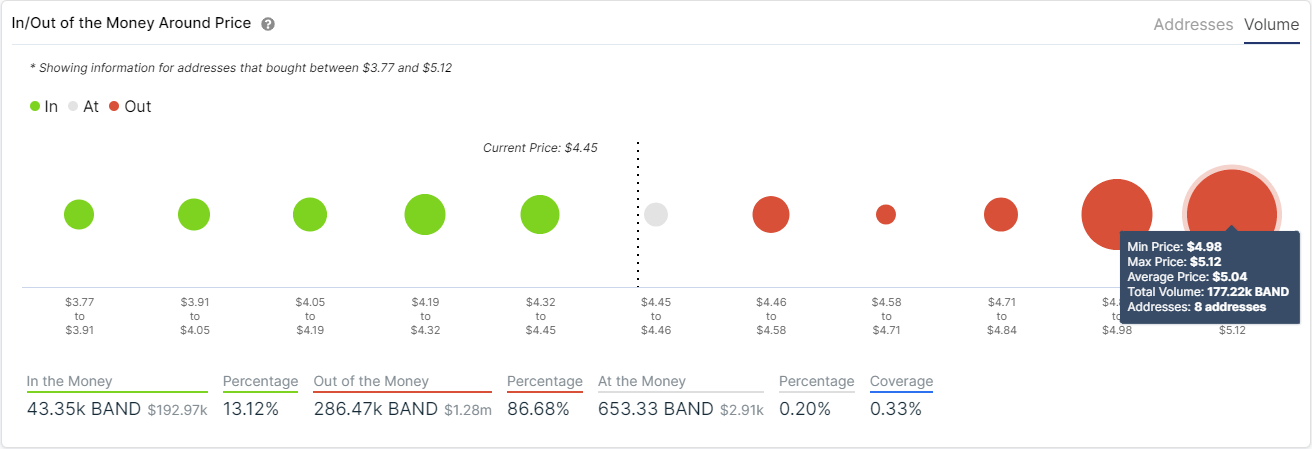
Validation and follow-through of this buy signal can drive the price of BAND up to $7 in the short-term and potentially towards $10. The In/Out of the Money Around Price chart shows the strongest resistance area to be contained between $4.98 and $5.12 with 177,000 BAND in volume.
BAND IOMAP chart
On the other hand, the IOMAP chart also shows very little support on the way down, which means that failure to hold the psychological support level can have a devastating effect on BAND'sND's price.
BAND active and new addresses chart
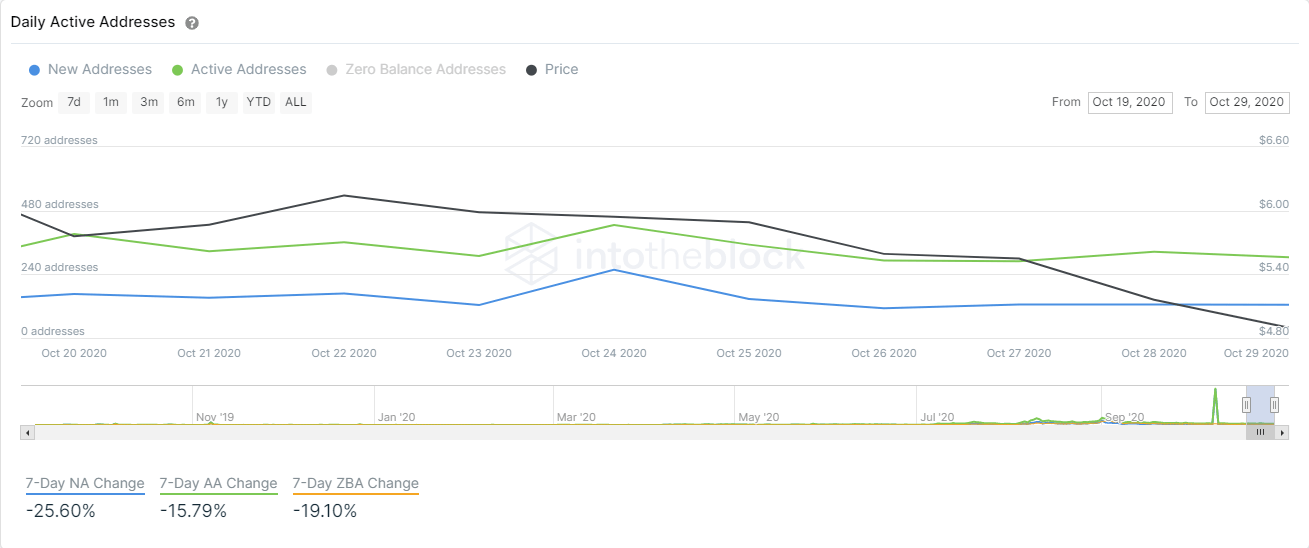
A breakdown below $4 could see Band Protocol drop to $3, $2, and as low as $1.1. Despite the price of BAND declining, the interest in the digital asset is not increasing. The chart of new and active addresses shows a decline in both. In the past seven days, the number of new addresses joining the network dropped by 25%. Similarly, there are 15% less active addresses over the past week, showing that the interest in the digital asset is low and there is no buying pressure.
Author

Lorenzo Stroe
Independent Analyst
Lorenzo is an experienced Technical Analyst and Content Writer who has been working in the cryptocurrency industry since 2012. He also has a passion for trading.



