Axie Infinity could spike over 60%, but downside risks for AXS remain
- Axie Infinity has a substantial bullish breakout long setup opportunity, but downside risks may dull any move higher.
- Point and Figure analysis warns of a deeper corrective move for AXS.
- Mixed signals may generate some stagnate trading activity.

Axie Infinity price has faced significant selling pressure since the beginning of November, dropping as much as 46% from the all-time high. AXS is currently down 42% from the all-time high. There are some signs that a strong rally may occur – but other signs point to further movement south.
Axie Infinity price action gives mixed signals as bulls and bears wait for confirmation
Axie Infinity has two solid signals for the long and short sides of the market. The theoretical short trade is a sell stop order at $85, a stop loss at $100, and a profit target at $35. The short idea is based on a Bearish Catapult pattern in Point and Figure Analysis.
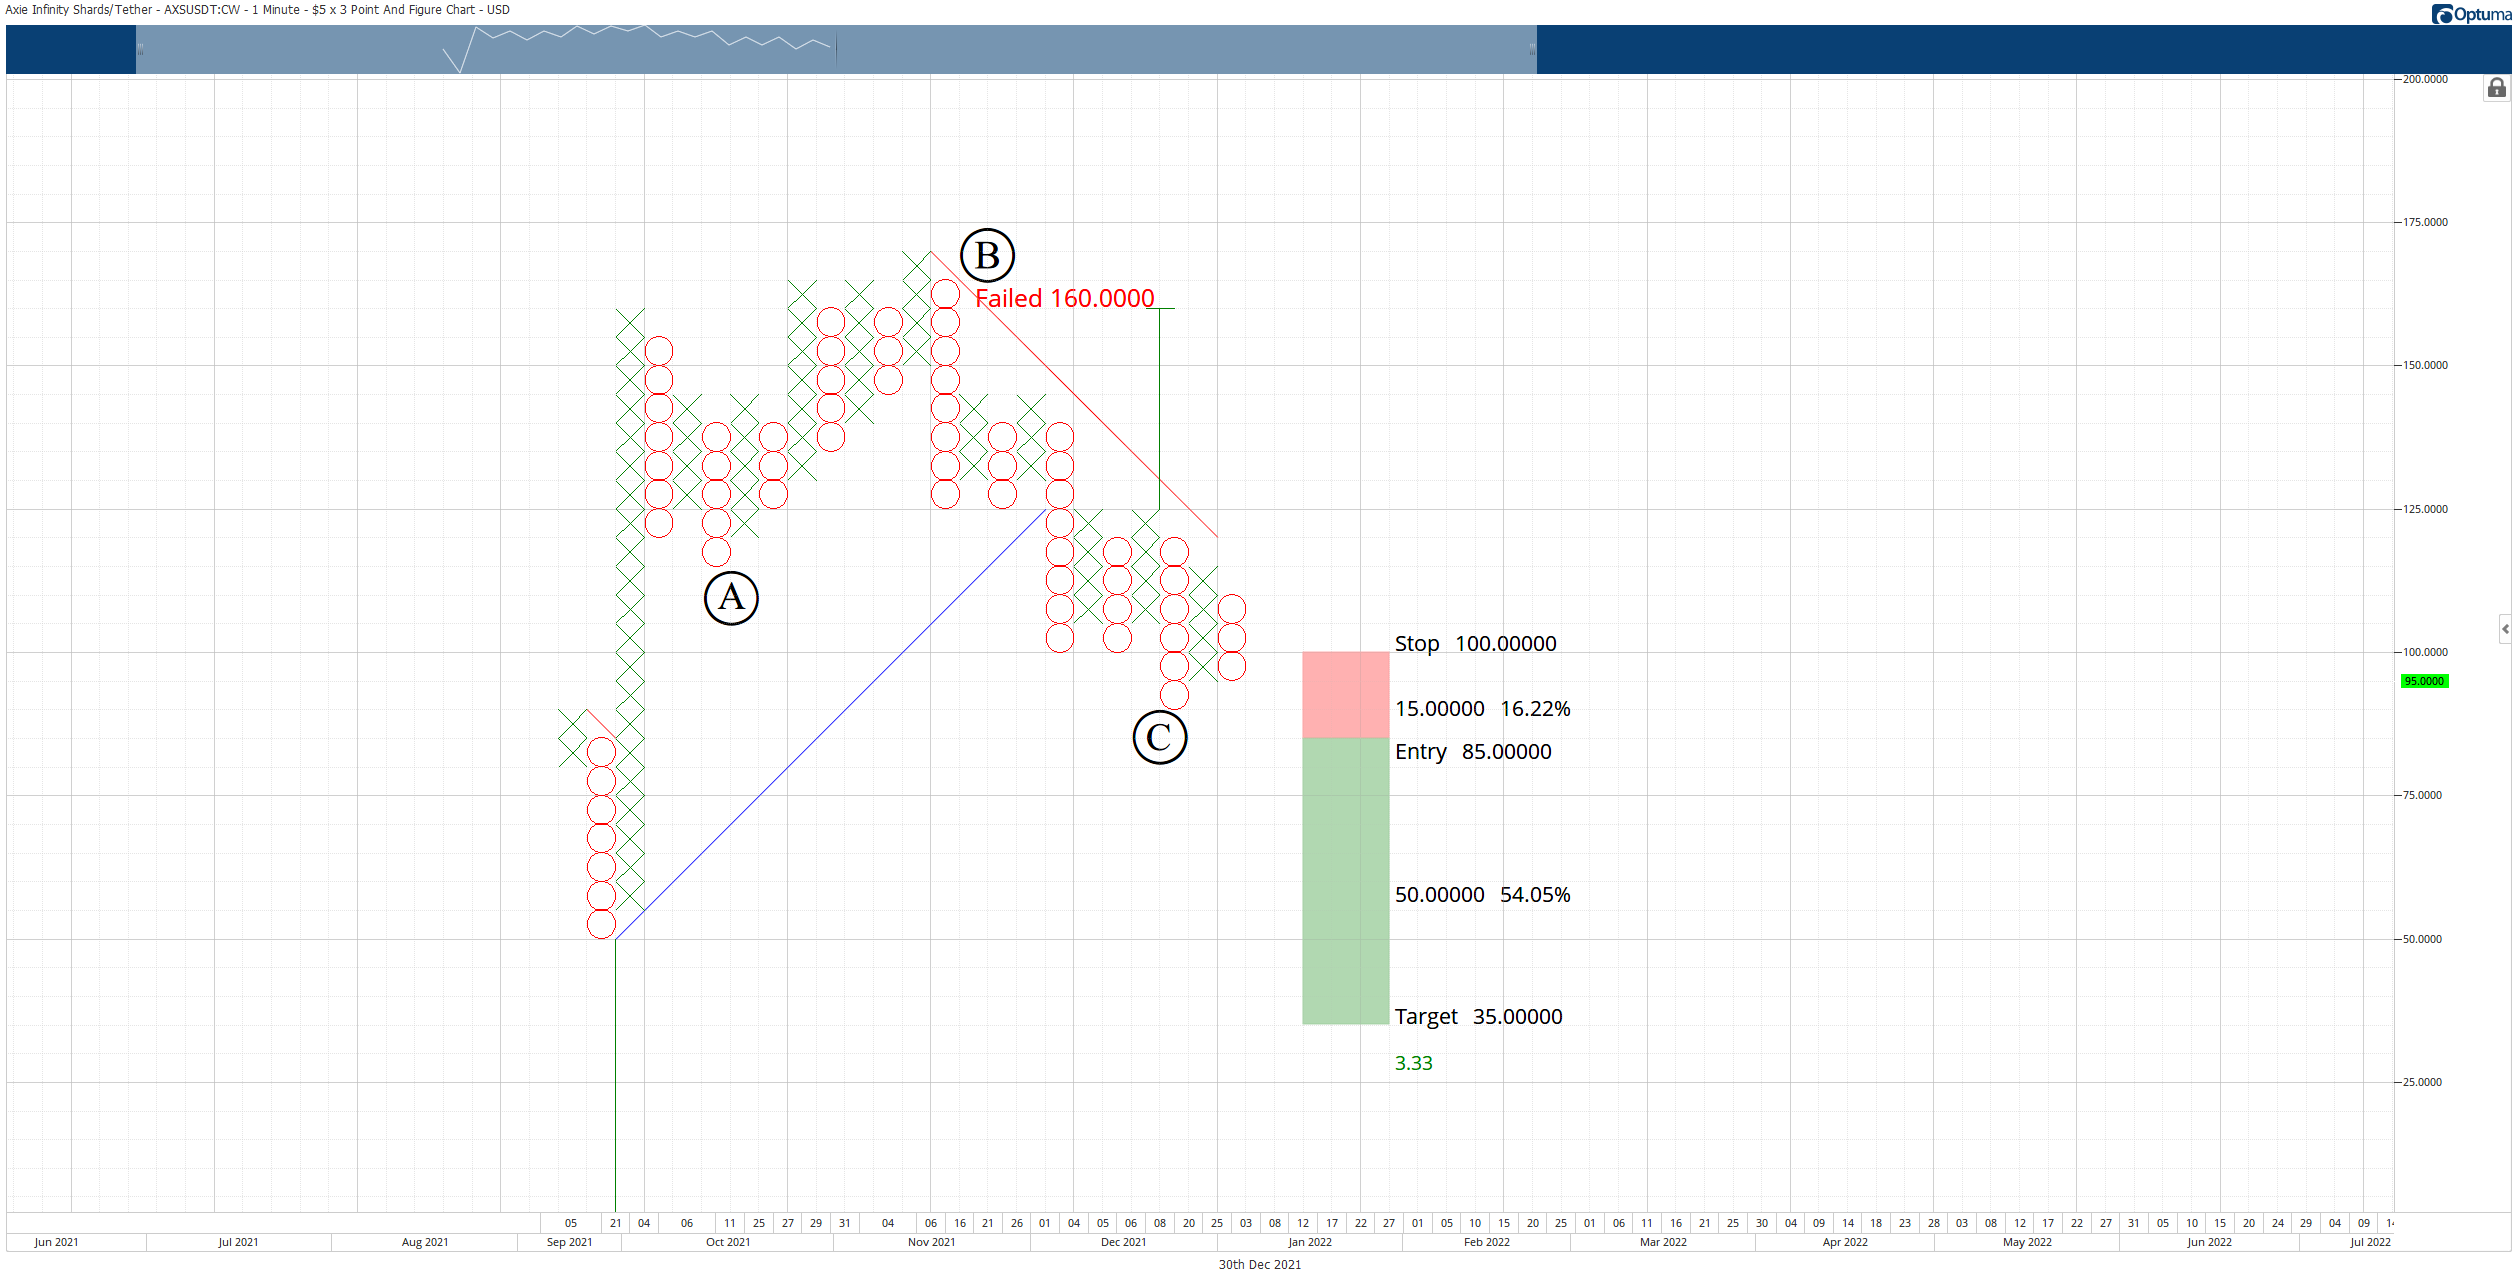
AXS/USDT $5.00/3-box Reversal Point and Figure Chart
The short entry represents a 3.33:1 reward for the risk and projects a 54% loss in value from the entry—the profit target of $35 just above the 50% Fibonacci retracement of $31.
The hypothetical long entry for Axie Infinity price is a buy stop at $120, a stop loss at $105, and a profit target at $170. AXS will have simultaneously broken out above a double-top and the bear market trendline if the entry is triggered, thereby converting AXS into a bull market.
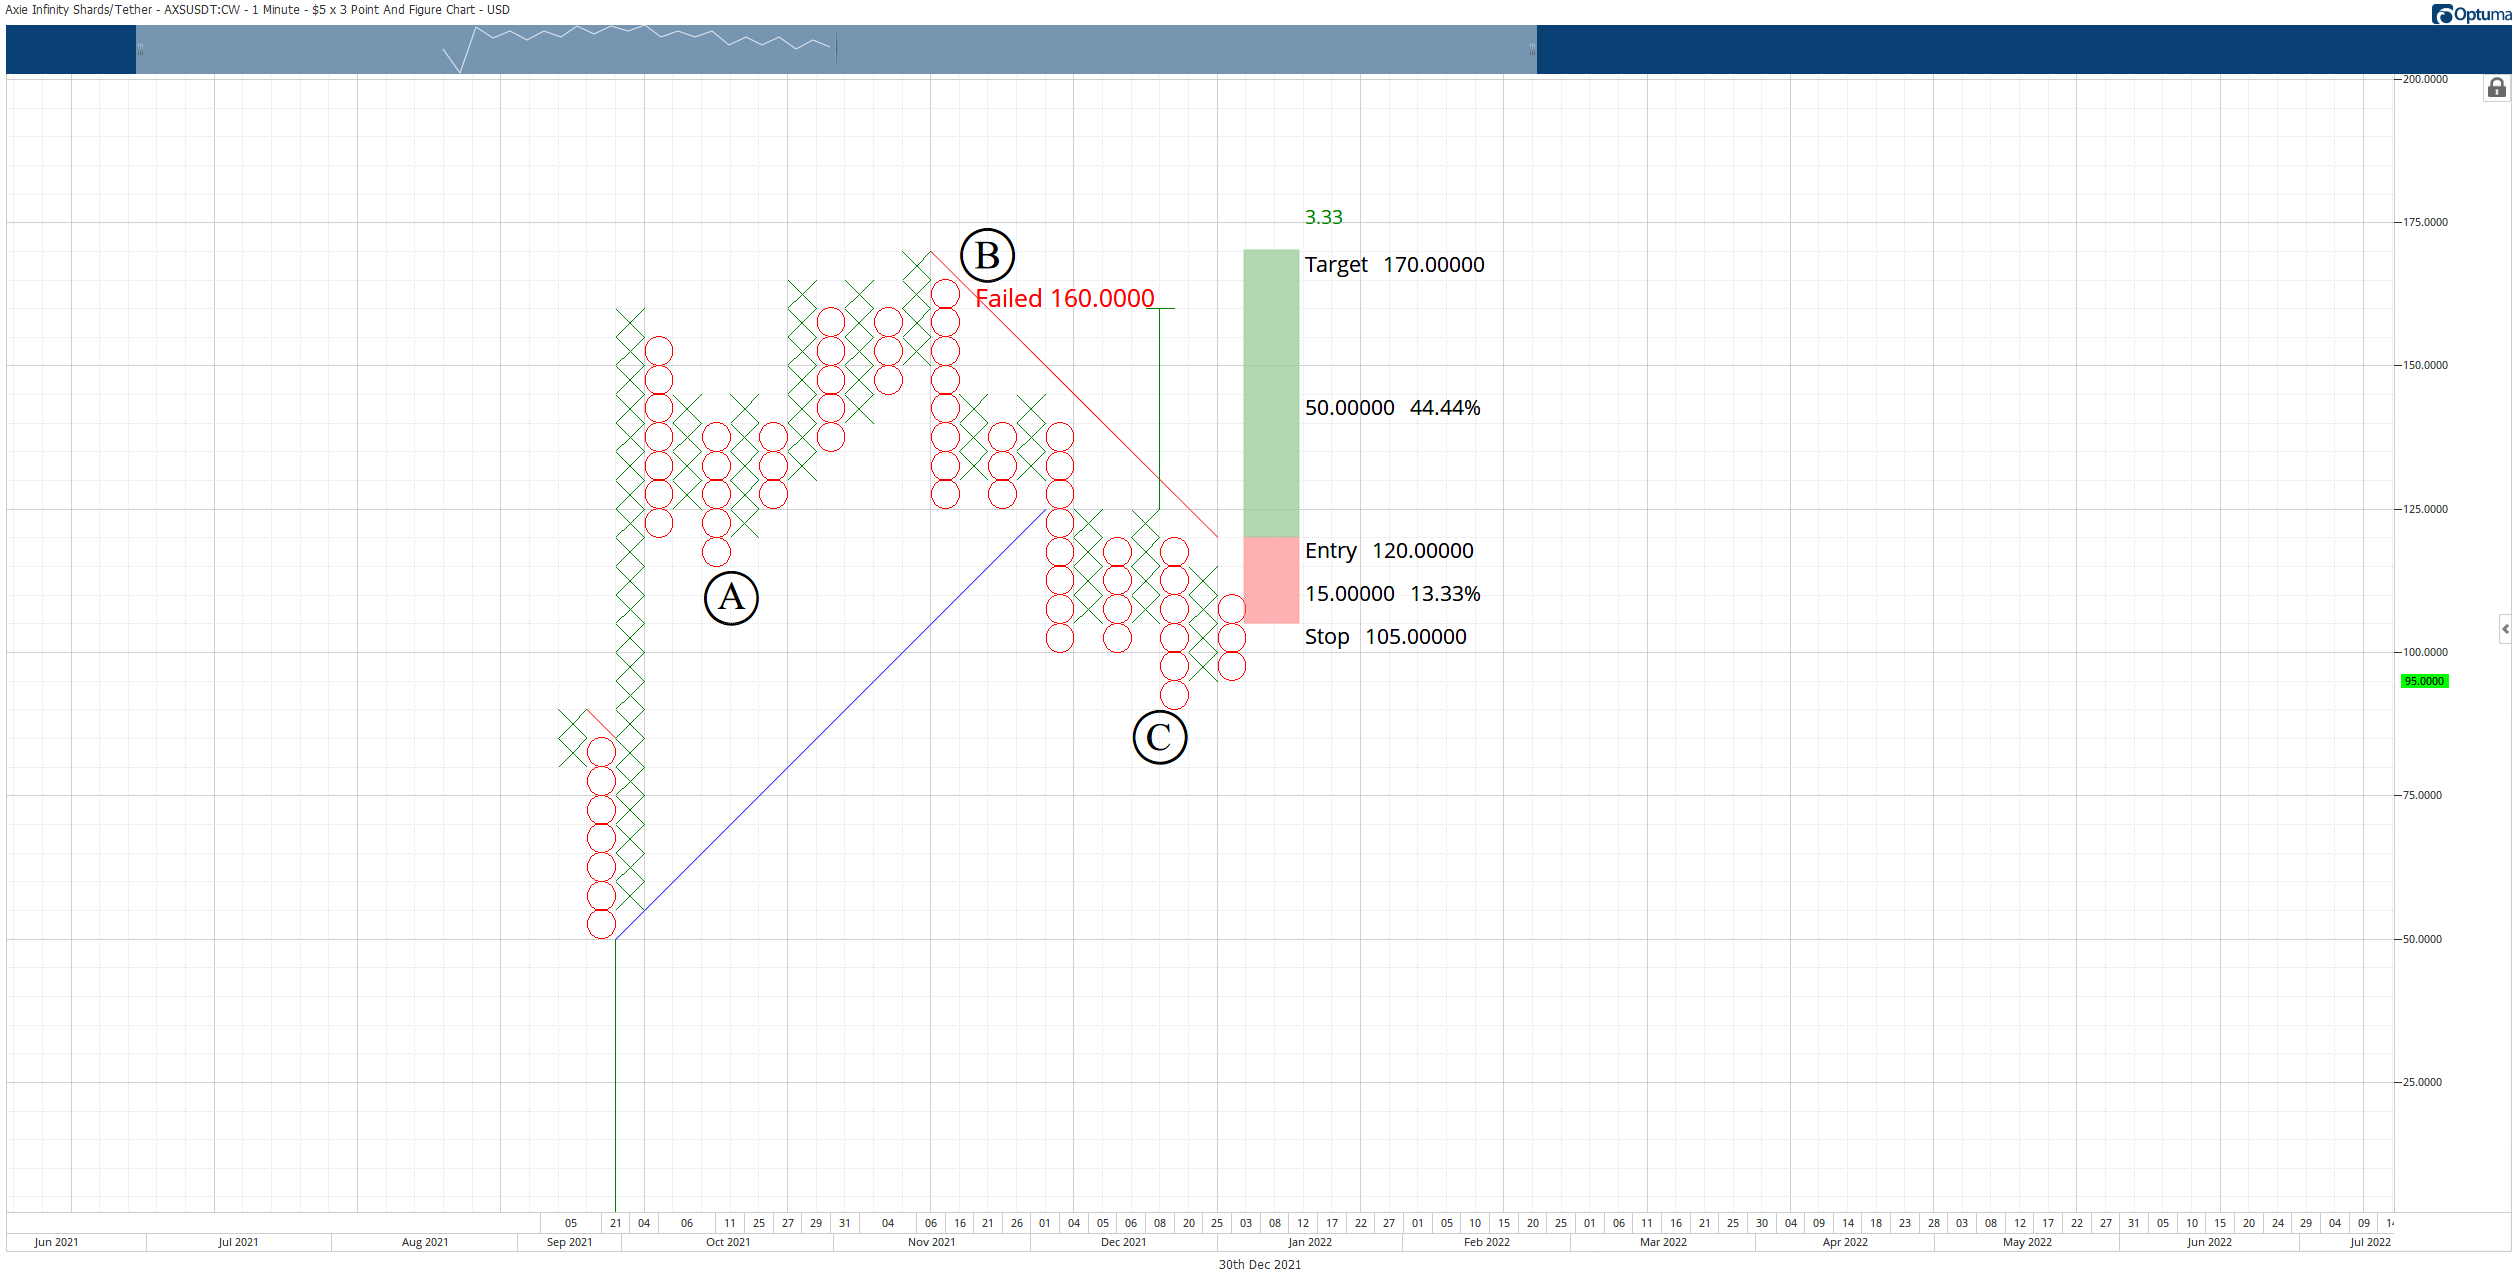
AXS/USDT $5.00/3-box Reversal Point and Figure Chart
The hypothetical long entry represents a 3.33:1 reward for the risk setup, with a projected 44% gain after the entry. A two to three-box trailing stop would preserve any implied profits post entry. The long entry is invalidated if the short entry is triggered first.
Author

Jonathan Morgan
Independent Analyst
Jonathan has been working as an Independent future, forex, and cryptocurrency trader and analyst for 8 years. He also has been writing for the past 5 years.



