Axie Infinity price to provide a buying opportunity before AXS rallies 40%
- Axie Infinity price is traversing a falling wedge pattern that suggests an 18% uptrend to $111.41 is likely upon breakout.
- In some cases, AXS could provide a buying opportunity at $79 before it triggers a run-up to $111.41.
- On-chain metrics support the bullish thesis explained above and indicate it is likely.

Axie Infinity price has been on a slow-moving downtrend since December 4. This downtrend could see an end as AXS reaches a critical point. The bullish outlook could begin from the get-go or after a brief downtrend. Either way, investors need to be prepared.
Axie Infinity price prepares for liftoff
Axie Infinity price set up five lower highs and three lower lows, which, when connected using trend lines, reveals a falling wedge formation. This technical formation forecasts an 18% upswing to $111.41, obtained by adding the distance between the first swing high and swing low to the breakout point at $94.02.
This scenario assumes that Axie Infinity price breaks out of the said pattern and reaches its target. However, this narrative is unlikely due to the fair value gap (FVG) present from $103.22 to $79. Investors should expect AXS to fill this void by retesting the $79 barrier, which will provide them with an opportunity to accumulate at a discount.
A retest of $79 will trigger a 40% ascent to the falling wedge’s theoretical target at $111.41. In a highly bullish case, Axie Infinity price could extend to $123.68.
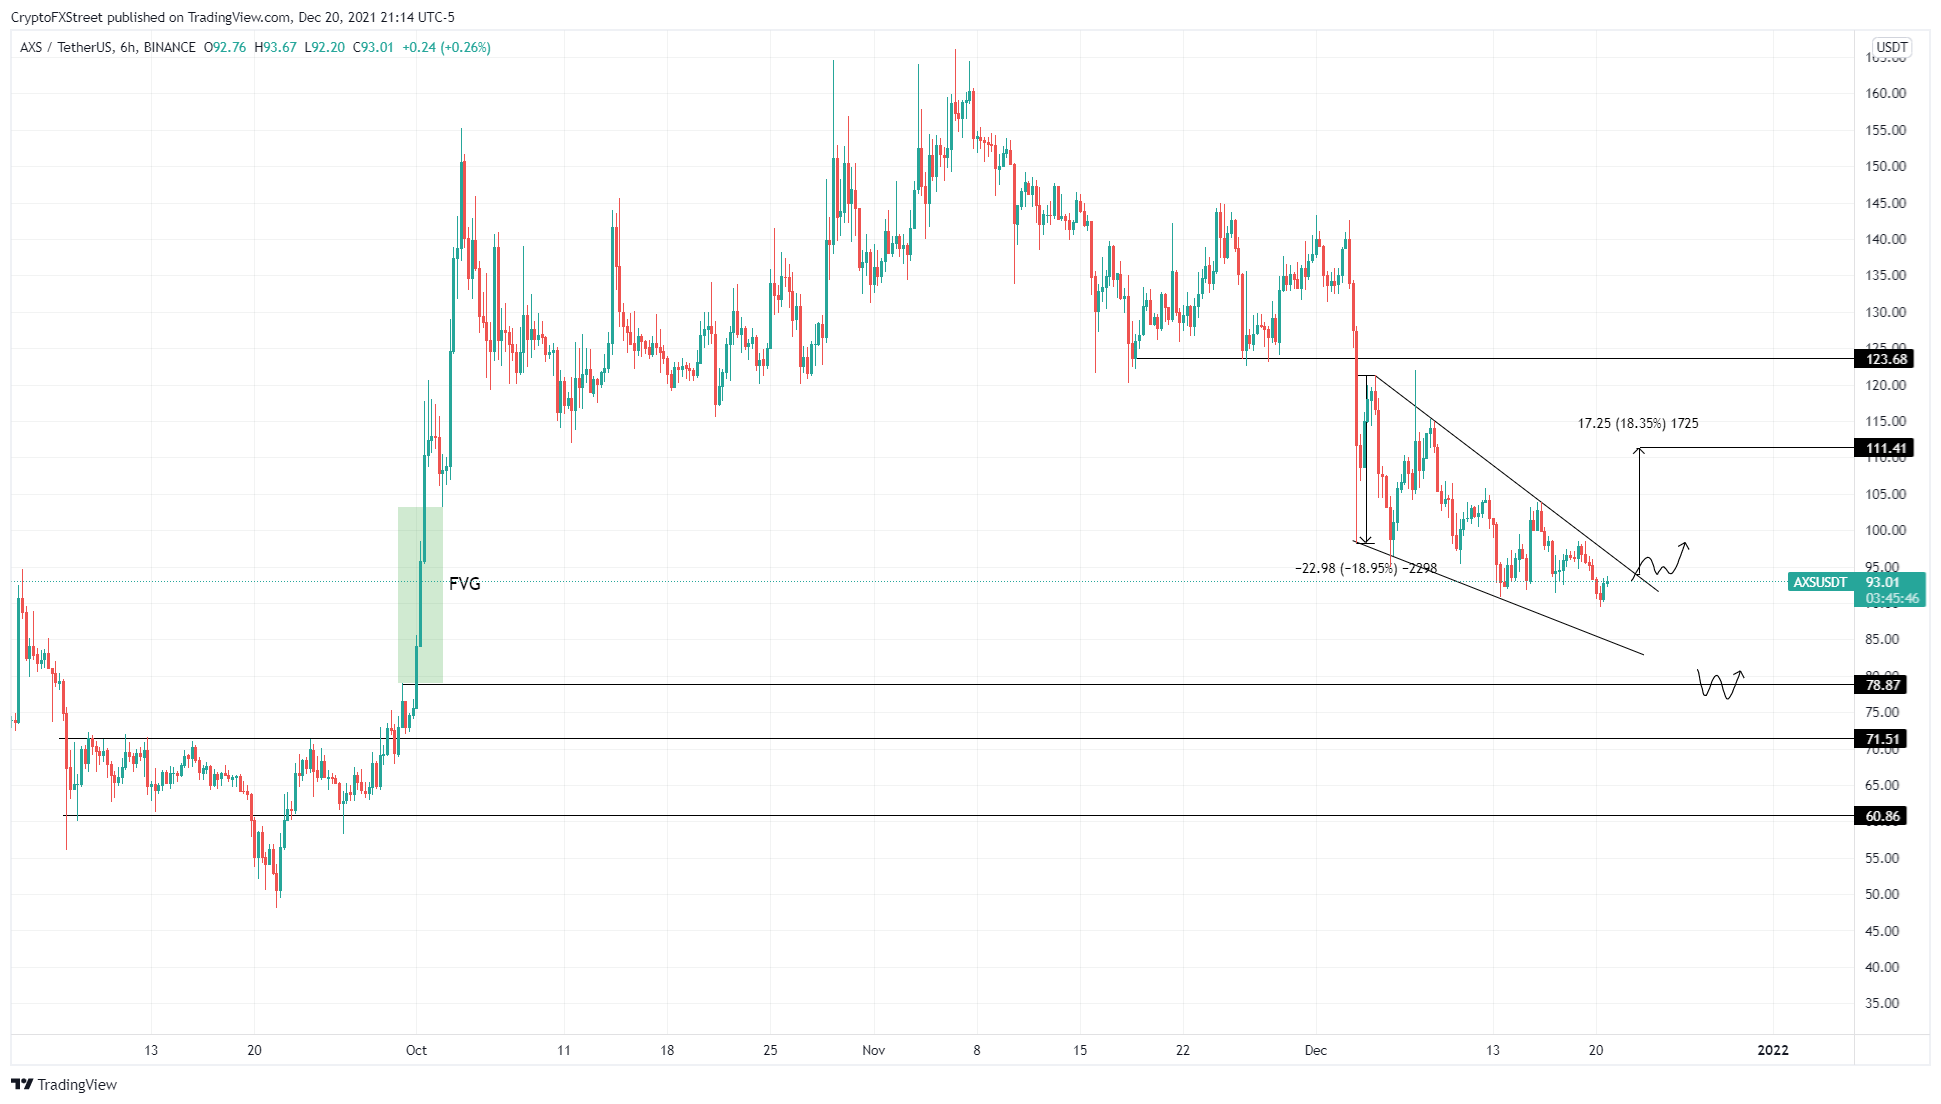
AXS/USDT 6-hour chart
Supporting this dip into the FVG is IntoTheBlock’s In/Out of the Money Around Price (IOMAP), which shows that the next meaningful support is present at $79. Here roughly 31 addresses purchased nearly 500,000 AXS tokens.
Therefore, these investors might serve as support by buying more AXS if it comes down to their level.
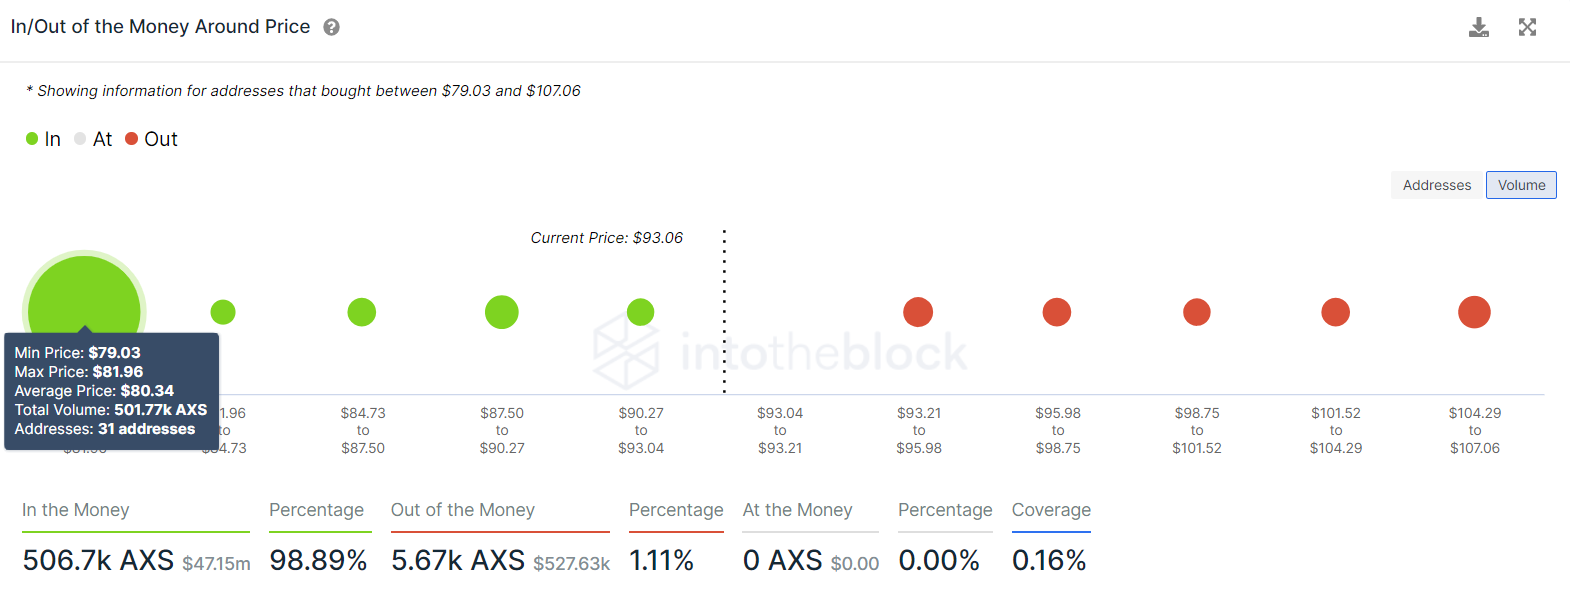
AXS IOMAP
Further signifying the need for a reversal is Santiment’s Market Value to Realized Value (MVRV) model, which hovers around -16.8%. This on-chain metric is used to determine the average profit/loss of investors that purchased AXS over the past month.
Therefore, the current value of MVRV indicates that these holders are at a loss and are less likely to offload their holdings and trigger a sell-off. Moreover, this fundamental index is in an “opportunity” zone, where long-term investors tend to accumulate.
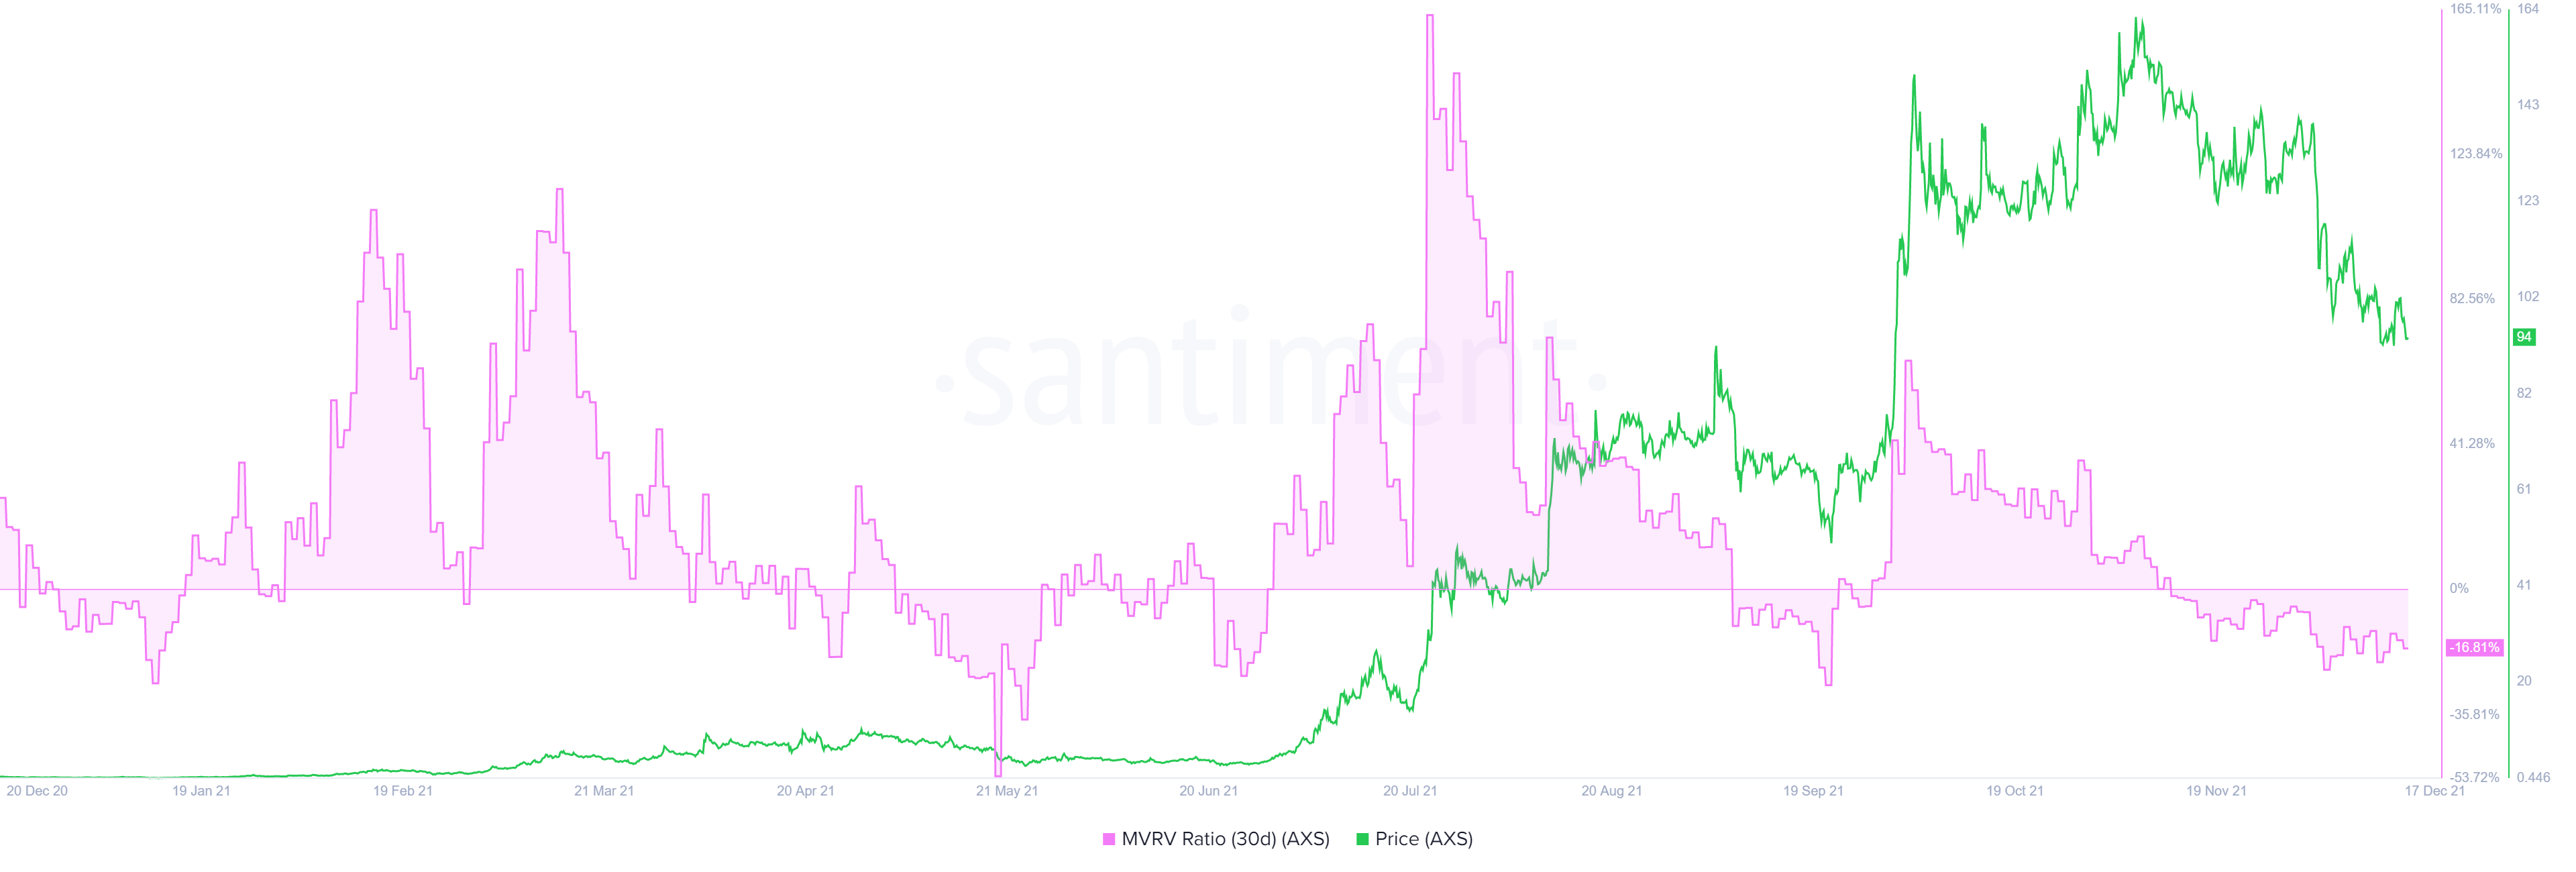
AXS MVRV
While things are looking bullish for Axie Infinity price, a breakdown of the $79 support level will indicate weak buying pressure and probably trigger a correction to the next barrier at $71.51. A six-hour candlestick close below this foothold will create a lower low and invalidate the bullish thesis.
Author

Akash Girimath
FXStreet
Akash Girimath is a Mechanical Engineer interested in the chaos of the financial markets. Trying to make sense of this convoluted yet fascinating space, he switched his engineering job to become a crypto reporter and analyst.