Avalanche Price Forecast: AVAX set to extend losses as Open Interest drops to one-month low


  • Avalanche edges higher on Wednesday after hitting a two-month low on Tuesday. 
  • Optimism in AVAX derivatives fades as Open Interest hits a 30-day low. 
  • The technical outlook indicates increased downside risks for Avalanche as it could break down from key support.

Avalanche (AVAX) trades in the green by almost 1% at press time on Wednesday, as it tests a crucial support floor that has held for over two months. The near-term outlook for the altcoin isn't promising, as Open Interest in the derivatives market has dropped to a 30-day low, and the technical outlook points to a steeper correction towards its year-to-date low.

Bearish sentiment sparks in AVAX derivatives markets

Coinglass’ data shows the AVAX Open Interest (OI) dropped to $441 million, a decline of over 3% in the last 24 hours. This marks the lowest value in 30 days, suggesting a continued capital outflow from AVAX derivatives as buying activity declines. 

Amid waning optimism, $1.40 million in longs were liquidated over 24 hours compared to $86K in short liquidations, suggesting a significant wipeout of bullish positions.

This aligns with the pullback in AVAX and drops the long-short ratio to 0.9451, signaling a greater number of active bearish positions. 

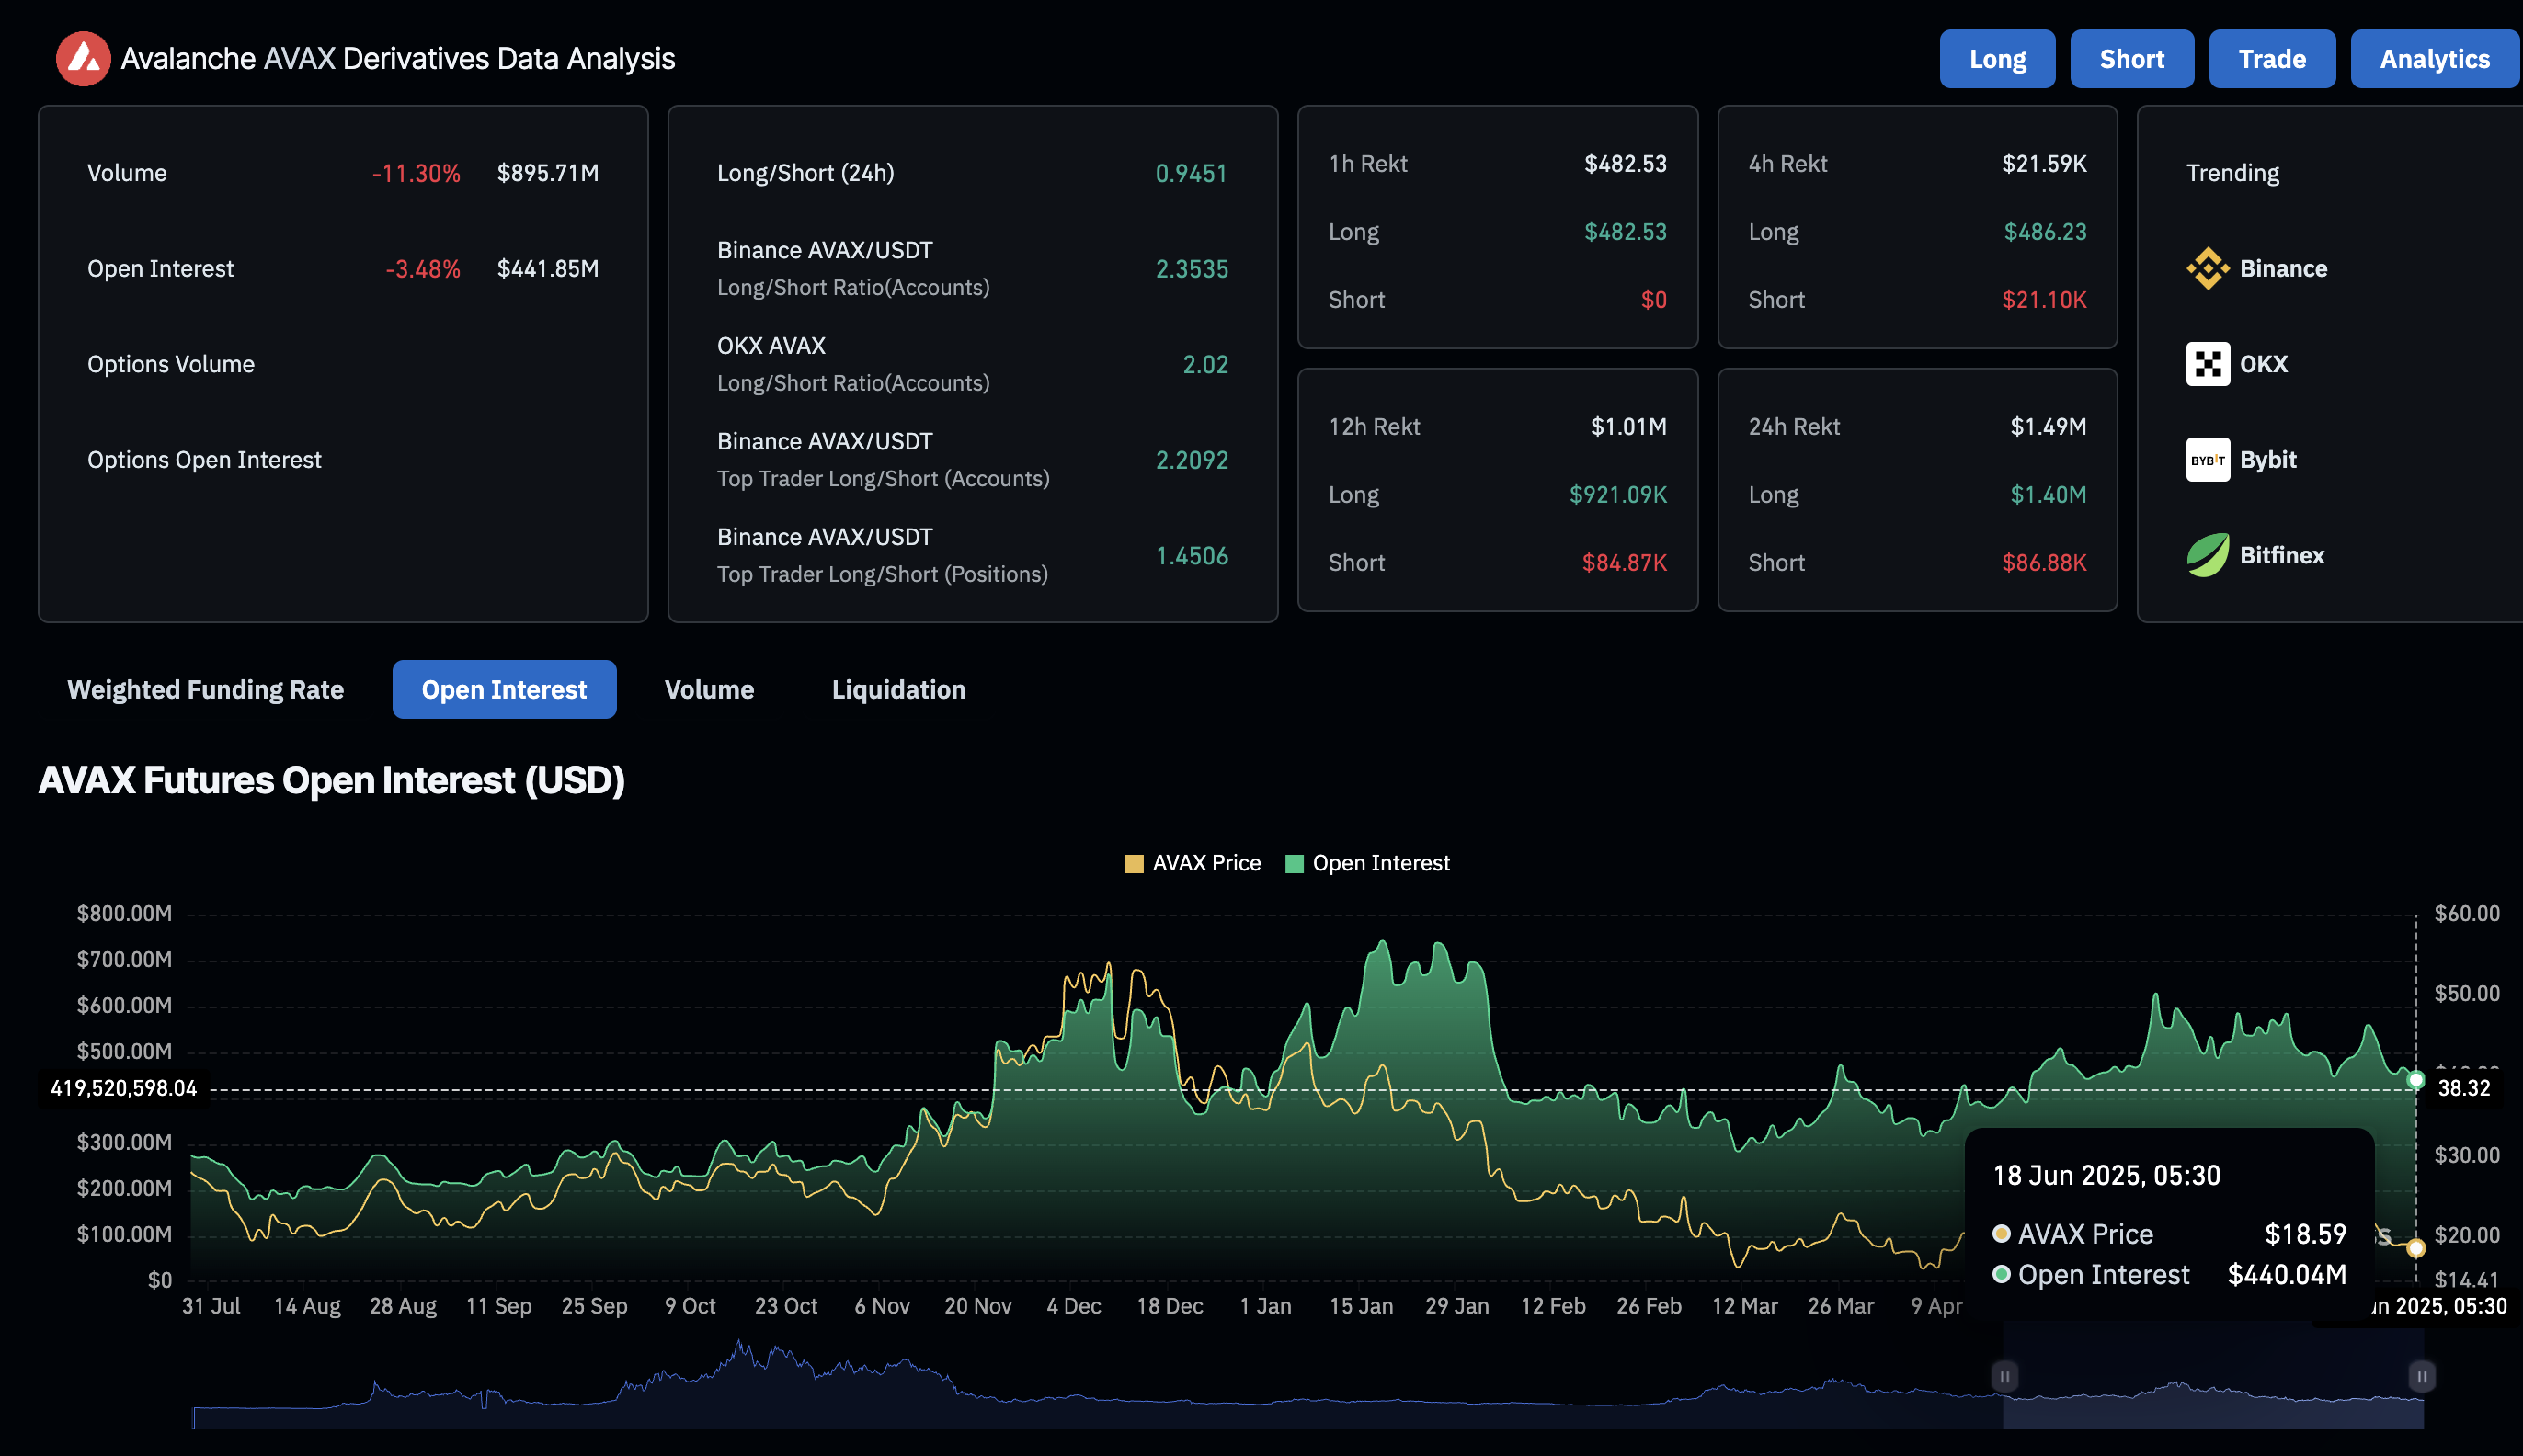
Avalanche derivatives. Source: Coinglass

The OI-weighted funding rate fluctuates near the zero line as sentiment among traders shifts. However, the data show an OI-weighted funding rate of 0.0022% as buying activity gains traction in the short term. 

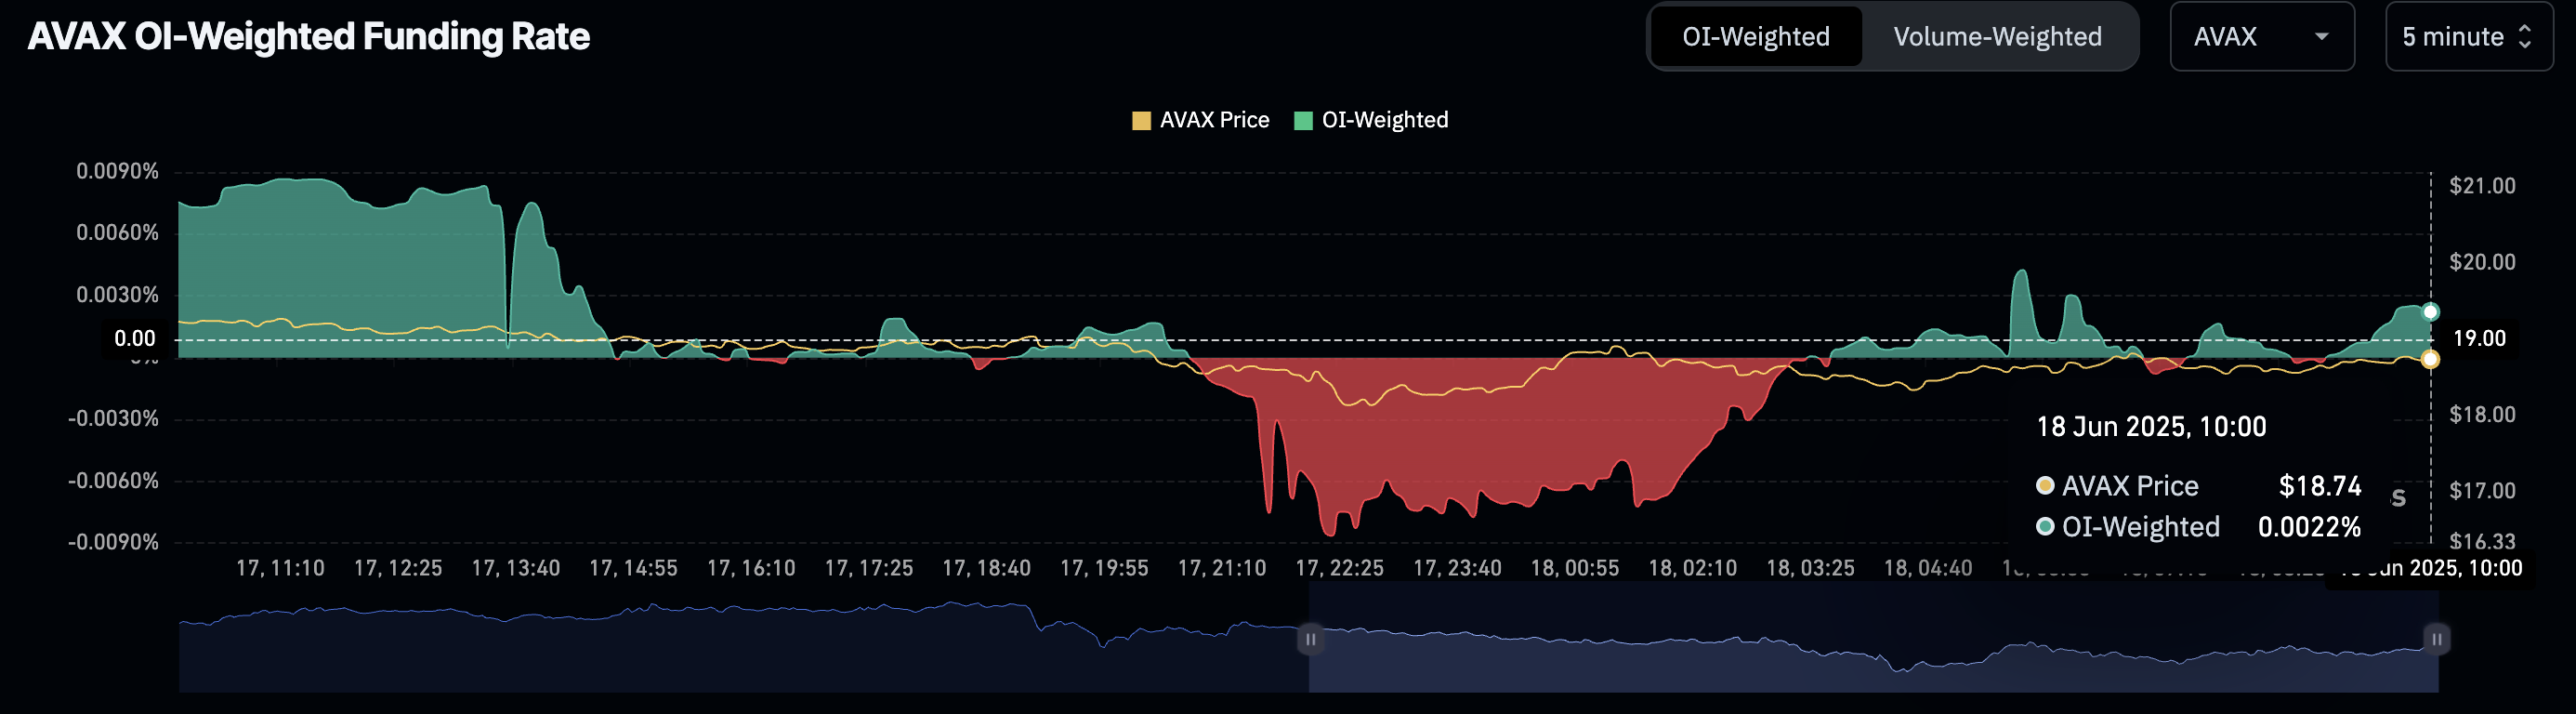
AVAX OI-weighted funding rate. Source: Coinglass

An apparent bearish inclination is visible in Avalanche derivatives as selling pressure grows. 

Avalanche eyes drop to $16

Avalanche holds above the $18.50 support marked by the April 16 low, recovering slightly from the $18.13 low posted on Tuesday. The AVAX price action reveals overhead pressure, with a couple of long wicked candles this week. 

Avalanche could extend its losses towards $16.14 support if it closes below the $18.50 floor, followed by the year-to-date low of $14.66.

The momentum indicators maintain a bearish bias on the daily chart as selling pressure grows. The Moving Average Convergence/Divergence (MACD) indicator fails to cross above its signal line, prolonging the declining trend. With rising red histograms below the zero line, the indicator suggests a surge in selling activity. 

The Relative Strength Index (RSI) at 38 is slightly above the oversold boundary, way below the halfway line. With still room on the downside, the indicator aligns with the breakdown possibility. 

Typically, in oversold conditions, bullish reversal chances are heightened. However, a potential consolidation in the oversold zone could prolong AVAX’s correction. 

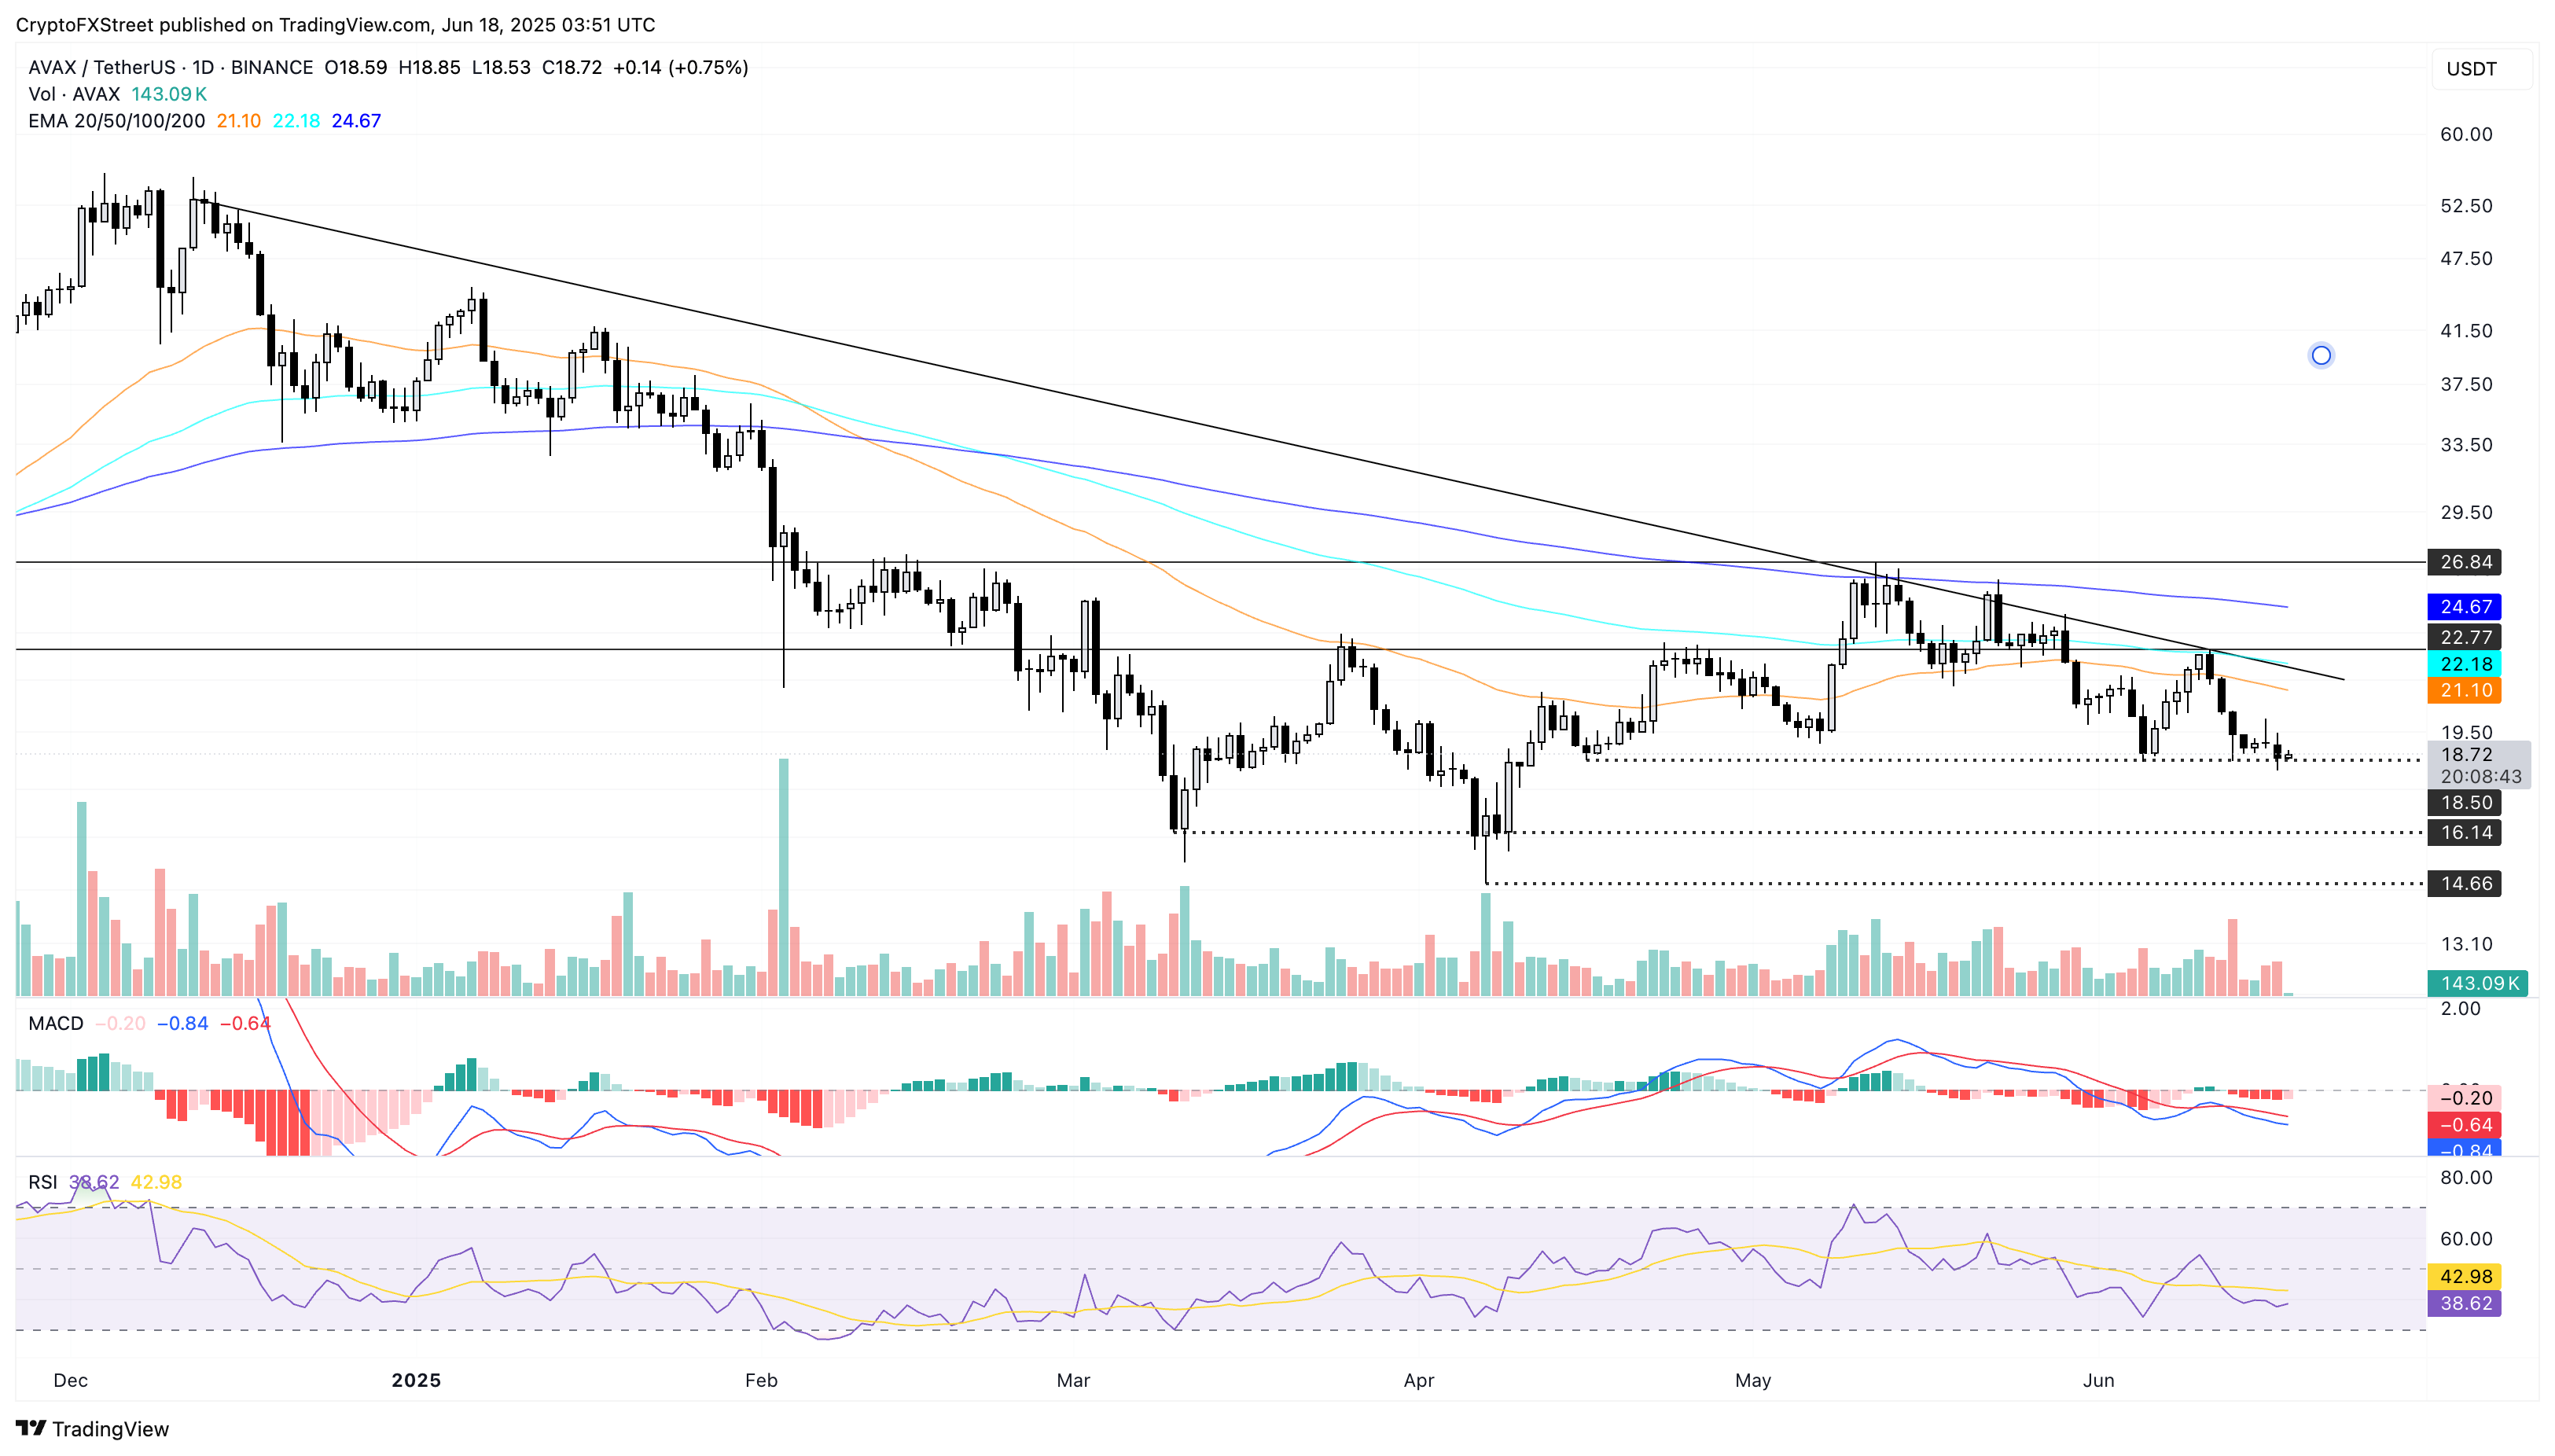
AVAX/USDT daily price chart.

Suppose Avalanche bounces off the $18.50 support level if the broader market stabilizes. It could propel AVAX towards the 50-day Exponential Moving Average (EMA) at $21.11.


Information on these pages contains forward-looking statements that involve risks and uncertainties. Markets and instruments profiled on this page are for informational purposes only and should not in any way come across as a recommendation to buy or sell in these assets. You should do your own thorough research before making any investment decisions. FXStreet does not in any way guarantee that this information is free from mistakes, errors, or material misstatements. It also does not guarantee that this information is of a timely nature. Investing in Open Markets involves a great deal of risk, including the loss of all or a portion of your investment, as well as emotional distress. All risks, losses and costs associated with investing, including total loss of principal, are your responsibility. The views and opinions expressed in this article are those of the authors and do not necessarily reflect the official policy or position of FXStreet nor its advertisers. The author will not be held responsible for information that is found at the end of links posted on this page.

If not otherwise explicitly mentioned in the body of the article, at the time of writing, the author has no position in any stock mentioned in this article and no business relationship with any company mentioned. The author has not received compensation for writing this article, other than from FXStreet.

FXStreet and the author do not provide personalized recommendations. The author makes no representations as to the accuracy, completeness, or suitability of this information. FXStreet and the author will not be liable for any errors, omissions or any losses, injuries or damages arising from this information and its display or use. Errors and omissions excepted.

The author and FXStreet are not registered investment advisors and nothing in this article is intended to be investment advice.

Recommended content


Recommended Content

Editors’ Picks

Pi Network Price Forecast: A Possible bullish pattern breakout in PI teases trend reversal

Pi Network Price Forecast: A Possible bullish pattern breakout in PI teases trend reversal

Pi Network edges higher at press time on Thursday as it trades in the green for the third consecutive day. The recovery could have been driven by the launch of the new Pi Node version, while the technical outlook shares the possibility of extended gains with a bullish pattern breakout. 

Sui Price Forecast: Technical breakout aims for $4.00, supported by TVL growth

Sui Price Forecast: Technical breakout aims for $4.00, supported by TVL growth

Sui extends its breakout above the descending channel and reclaims the 100-day EMA at $3.07 as support. Sui’s DeFi Total Value Locked nears the $2 billion mark, indicating rising investor confidence.

Bitcoin eyes $120,000 as prospects of Fed rate cuts fuel market optimism

Bitcoin eyes $120,000 as prospects of Fed rate cuts fuel market optimism

Bitcoin price stabilizes around 111,000 on Thursday after hitting a record high of nearly $112,000 the previous day. Fed Minutes spark renewed risk-on sentiment as it showed officials foresee interest rate cuts later this year, boosting momentum across markets.

Crypto Today: Bitcoin's new all-time high reignites risk-on sentiment as Ethereum, XRP bulls increase exposure

Crypto Today: Bitcoin's new all-time high reignites risk-on sentiment as Ethereum, XRP bulls increase exposure

Bitcoin could extend its price discovery phase amid renewed risk-on sentiment following its new record high. Ethereum extends gains toward $2,880 critical resistance on the backdrop of rising spot ETF inflows.

Bitcoin: BTC ends Q2 with 30% gains, Standard Chartered eyes $200K by year-end

Bitcoin: BTC ends Q2 with 30% gains, Standard Chartered eyes $200K by year-end

Bitcoin (BTC) closed a strong second quarter (Q2), recording nearly 30% in quarterly gains amid rising corporate and institutional demand and bullish market sentiment.

The Best brokers to trade EUR/USD

The Best brokers to trade EUR/USD

SPONSORED Discover the top brokers for trading EUR/USD in 2025. Our list features brokers with competitive spreads, fast execution, and powerful platforms. Whether you're a beginner or an expert, find the right partner to navigate the dynamic Forex market.

BTC

ETH

XRP