Avalanche price eyes upside move on bullish technicals
- Avalanche price retests its weekly support at $22.89, bounces 9%, and trades 1% higher at $25.45 on Tuesday.
- Technical analysis shows that AVAX has formed a bullish divergence on a momentum indicator.
- A daily candlestick close below $21.89 would invalidate the bullish thesis.

Avalanche (AVAX) price tested its weekly support at $22.89 on July 5, rebounded by 9% the next day, and is currently trading 1% higher at $25.45 on Tuesday. Technical analysis reveals bullish divergence signals from the Relative Strength Index (RSI) and the Awesome Oscillator (AO), suggesting a potential upward rally ahead.
AVAX price shows potential for an upside move
Avalanche price retested its weekly support level of $22.89 on July 5 and surged by 9% on July 6. As of the latest update, it is trading 1% higher at $25.45 on Tuesday.
Additionally, on the daily chart, the formation of a lower low on July 5 contrasts with the Relative Strength Index's (RSI) higher highs during the same period. This development is termed a bullish divergence and often leads to the reversal of the trend or a short-term rally.
If the $22.89 level holds, AVAX could rally 8.6% from its current trading price of $25.45 to tag its daily high of $27.61 on July 6.
Moreover, if AVAX closes above $27.61, it could extend an additional 15% rally to retest its daily resistance level of $31.36. This resistance level also coincides with the 50% price retracement level between $41.80 and $21.89.
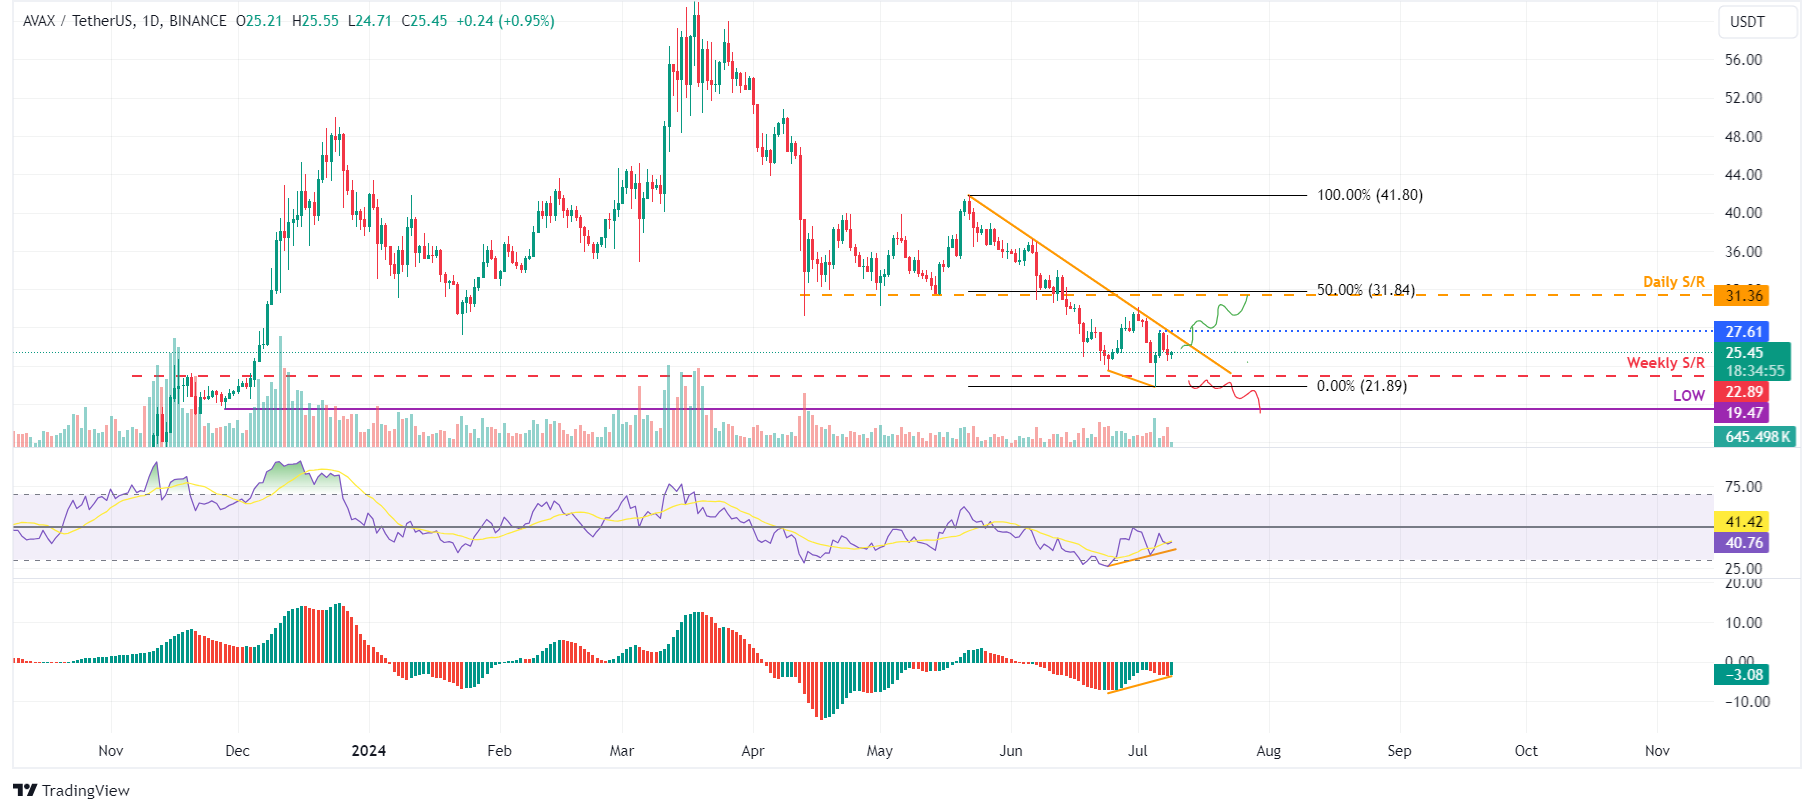
AVAX/USDT daily chart
However, if the AVAX price produces a daily candlestick close below $21.89, it would produce a lower low in the daily time frame. Such a development would give rise to a bearish market structure. This change in market structure would invalidate the bullish thesis and catalyze an 11% crash in the Avalanche’s price to retest its low of $19.47 on November 28, 2023.
Author

Manish Chhetri
FXStreet
Manish Chhetri is a crypto specialist with over four years of experience in the cryptocurrency industry.



