- Cosmos price lost 20% of market value this month and has since recovered by 16%.
- Together the Relative Strength Index and Volume Profile Indicator suggest the bear is still in control of the ATOM price.
- Invalidation of the bearish thesis is a breach above $11.14.
Cosmos price (ATOM) is producing a countertrend rally after suffering a steep decline throughout the month. If market conditions persist, ATOM could wipe out newly established bullish positions. Key levels have been defined to gauge ATOM’s next potential move.
Cosmos price points lower
Cosmos price has declined by 40% since the start of November. During the downswings, the bulls have struggled to retaliate for more than a day or so before the bears initiate another attack. On November 21, the ATOM price fell to a new monthly low at $8.72. Following the decline, the bulls have produced a 16% countertrend spike. Despite the optimistic gesture, the technicals suggest the bears will continue to flex their reign.
ATOM price currently auctions at $10.16. A Fibonacci retracement tool surrounding the summer low at $5.55 into the September high at $17.13 shows the recent bottom as a few cents shy of the 61.8% Fib level. The bullish hammer on the daily chart likely enticed bulls to enter the market.
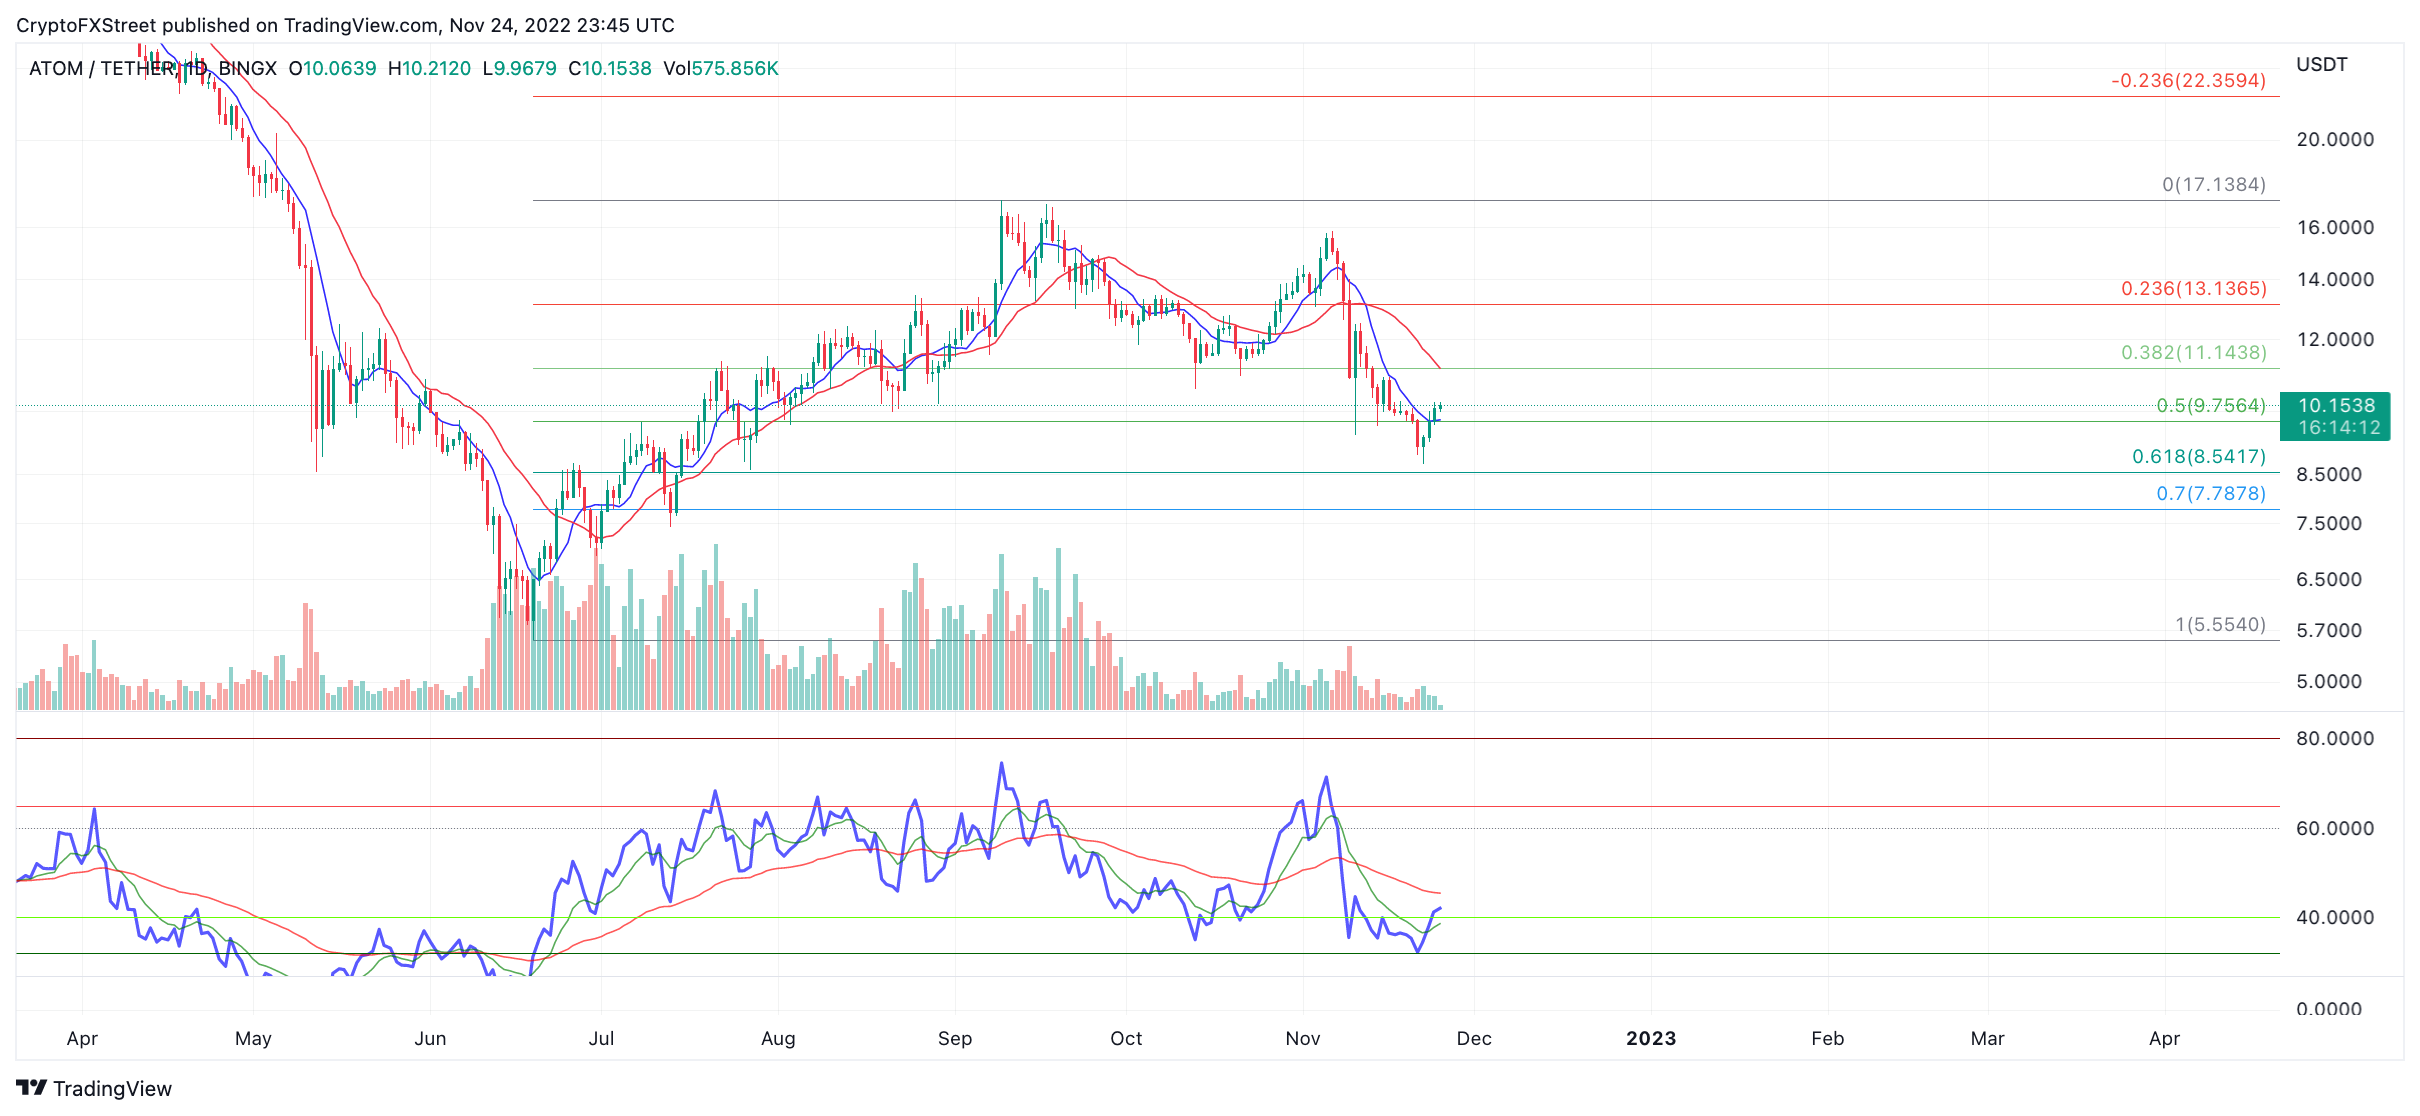
ATOM/USDT 1-Day Chart
Still, Volume Profile Indicator remains sparse during the uptrend retaliation. Additionally, the Relative Strength Index printed a new low, unlike Ethereum and Bitcoin, which produced bullish divergences during the November 21 selloff.
When combined, there are enough reasons to suggest ATOM has lower targets to breach. The next key areas of interest are the 61.8% Fib level at $8.54 and potentially the liquidity below $7.70. Invalidation of the bearish outlook lies above the 21-day simple moving average at $11.14. If the bulls hurdle the barrier, an additional uptrend hike targeting the $13 liquidity zone will stand a fair chance of occurring. Such a move would result in a 33% increase from the current Cosmos price
In the following video, our analysts dive deep into the price action of Bitcoin, analyzing key market interest levels. -FXStreet Team
Information on these pages contains forward-looking statements that involve risks and uncertainties. Markets and instruments profiled on this page are for informational purposes only and should not in any way come across as a recommendation to buy or sell in these assets. You should do your own thorough research before making any investment decisions. FXStreet does not in any way guarantee that this information is free from mistakes, errors, or material misstatements. It also does not guarantee that this information is of a timely nature. Investing in Open Markets involves a great deal of risk, including the loss of all or a portion of your investment, as well as emotional distress. All risks, losses and costs associated with investing, including total loss of principal, are your responsibility. The views and opinions expressed in this article are those of the authors and do not necessarily reflect the official policy or position of FXStreet nor its advertisers. The author will not be held responsible for information that is found at the end of links posted on this page.
If not otherwise explicitly mentioned in the body of the article, at the time of writing, the author has no position in any stock mentioned in this article and no business relationship with any company mentioned. The author has not received compensation for writing this article, other than from FXStreet.
FXStreet and the author do not provide personalized recommendations. The author makes no representations as to the accuracy, completeness, or suitability of this information. FXStreet and the author will not be liable for any errors, omissions or any losses, injuries or damages arising from this information and its display or use. Errors and omissions excepted.
The author and FXStreet are not registered investment advisors and nothing in this article is intended to be investment advice.
Recommended Content
Editors’ Picks
Three altcoins that have kickstarted Q4 rally: LINK, RDNT, FLOKI

Chainlink price has been on a tear for the last two weeks and has the potential for more upside. Radiant Capital price has breached a falling wedge and shows promise of further ascent.
Week ahead: Fed speech and NFP likely to dictate crypto market moves this week

With the start of 2023’s fourth quarter, things are finally getting interesting in crypto. While the next 12 weeks are extremely important, let’s start by focusing on what to expect this week.
DOT confirms trend reversal, eyes retest of $5 after reclaiming key hurdle

Polkadot price trades inside a tight range above a critical support level of $3.98. The daily RSI produced a higher high, signaling a surge in bullish momentum and a potential breakout scenario.
FLOKI sets stage for 30% rally

Floki Inu (FLOKI) price has triggered a quick but explosive uptrend in the last 24 hours. The uptrend has pushed the meme coin above a key hurdle and could assist FLOKI bulls in reversing the downtrend.
Bitcoin: BTC recovery rally could be bull trap in disguise, here’s why

Bitcoin (BTC) price remains unfazed even after the multiple spot BTC ETF delays from the US Securities & Exchange Commission (SEC). But investors need to be careful with the ongoing BTC rally as it could be a trap for early bulls.