Aster Price Forecast: ASTER bulls aim for breakout run as trading volume tops $3 trillion
- Aster extends recovery on Wednesday as buying pressure resurfaces.
- Trading volume exceeds $3 trillion for the first time ever, but declining protocol fees and Open Interest suggest lower demand ahead.
- The technical outlook indicates a bullish incline as recovery gains traction.

Aster (ASTER) edges higher by over 8% at press time on Wednesday, approaching a key dynamic resistance at $1.21. On-chain data shows the perpetuals-focused Decentralized Exchange (DEX), backed by Binance, has recorded a total trading volume of over $3 trillion, despite short-term fluctuations in user adoption.
The technical outlook for Aster remains bullish as the short-term recovery gains traction, inching closer to a potential breakout of an ascending triangle pattern.
Declining protocol fees as trading volume tops $3 trillion flash mixed on-chain signals
Aster reached a milestone of trading volume exceeding $3 trillion, approaching Hyperliquid’s $3.20 trillion since inception. As of Wednesday, the total trading volume on Aster records $3.10 trillion, with a Total Value Locked (TVL) of $1.16 billion.
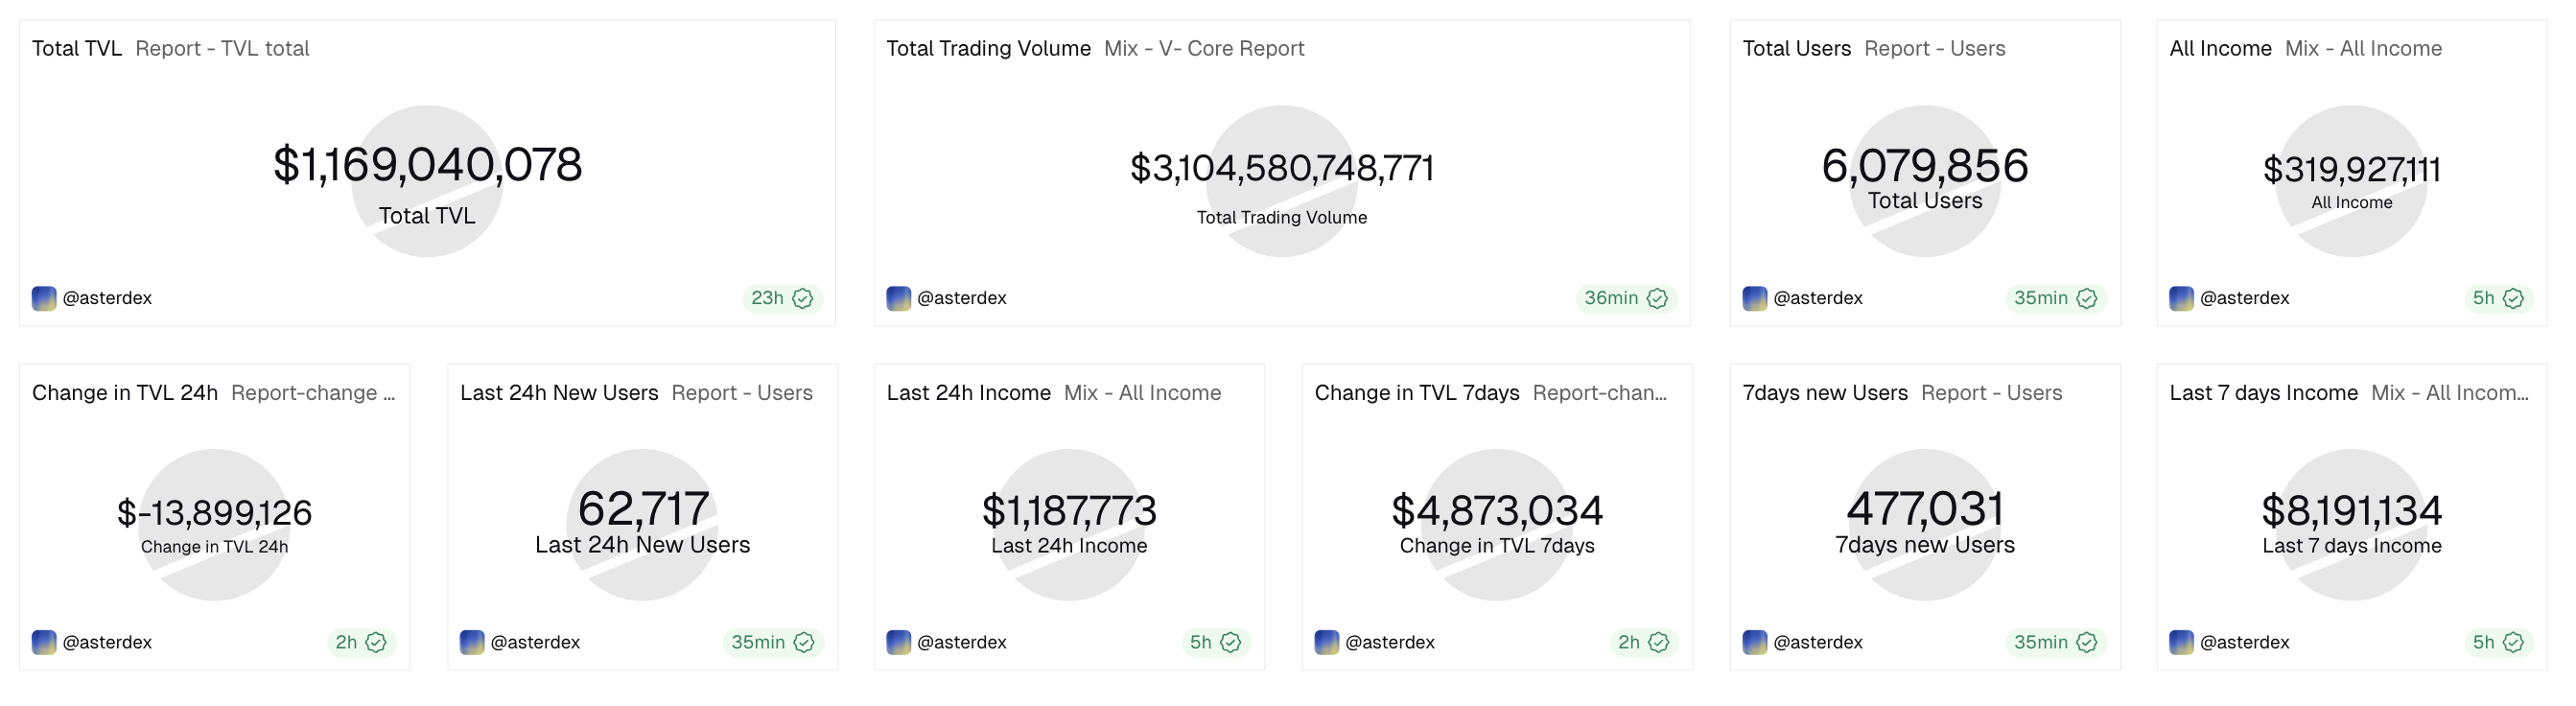
On a relatively negative note, on-chain data shows stagnation in user adoption, as evidenced by declining protocol fees. DeFiLlama data shows that the fees have fluctuated below $20 million since mid-October, with $15.83 million collected last week.

At the same time, the Open Interest (OI) on Aster, which represents the notional value of all outstanding perpetual contracts for the listed tokens on the platform, stands at $2.669 billion, down from $5.011 billion as of October 5. This decrease in OI suggests a risk-off sentiment among traders, which aligns with the lower fees collected by the Binance-backed DEX.
Adding to the low trading activity, the perp volume amounted to $72.023 billion last week, down from $76.657 billion in mid-October. The perp volume stands at $20.56 billion so far this week, with no major signs of recovery ahead.
Aster’s rebound aims for a breakout rally
Aster extends the short-term recovery and exceeds the $1.1742 resistance level to challenge the 200-period Exponential Moving Average (EMA) on the 4-hour chart at $1.2106, with bulls aiming for a decisive close above this line.
If ASTER successfully holds a close above $1.2106, it would confirm the breakout of an ascending triangle pattern formed by a local support trendline since November 5 and the $1.1742 resistance level. The potential breakout rally could target the October 14 low of $1.2977, followed by the October 13 high of $1.5990.
Corroborating the upside potential, the technical indicators on the 4-hour chart show increased buying pressure, as the Relative Strength Index (RSI) at 63 rises from the neutral level, with further room for growth before reaching the overbought zone.
The Moving Average Convergence Divergence (MACD) bounces off its signal line, accompanied by rising green histogram bars, which indicate a sudden increase in bullish momentum.
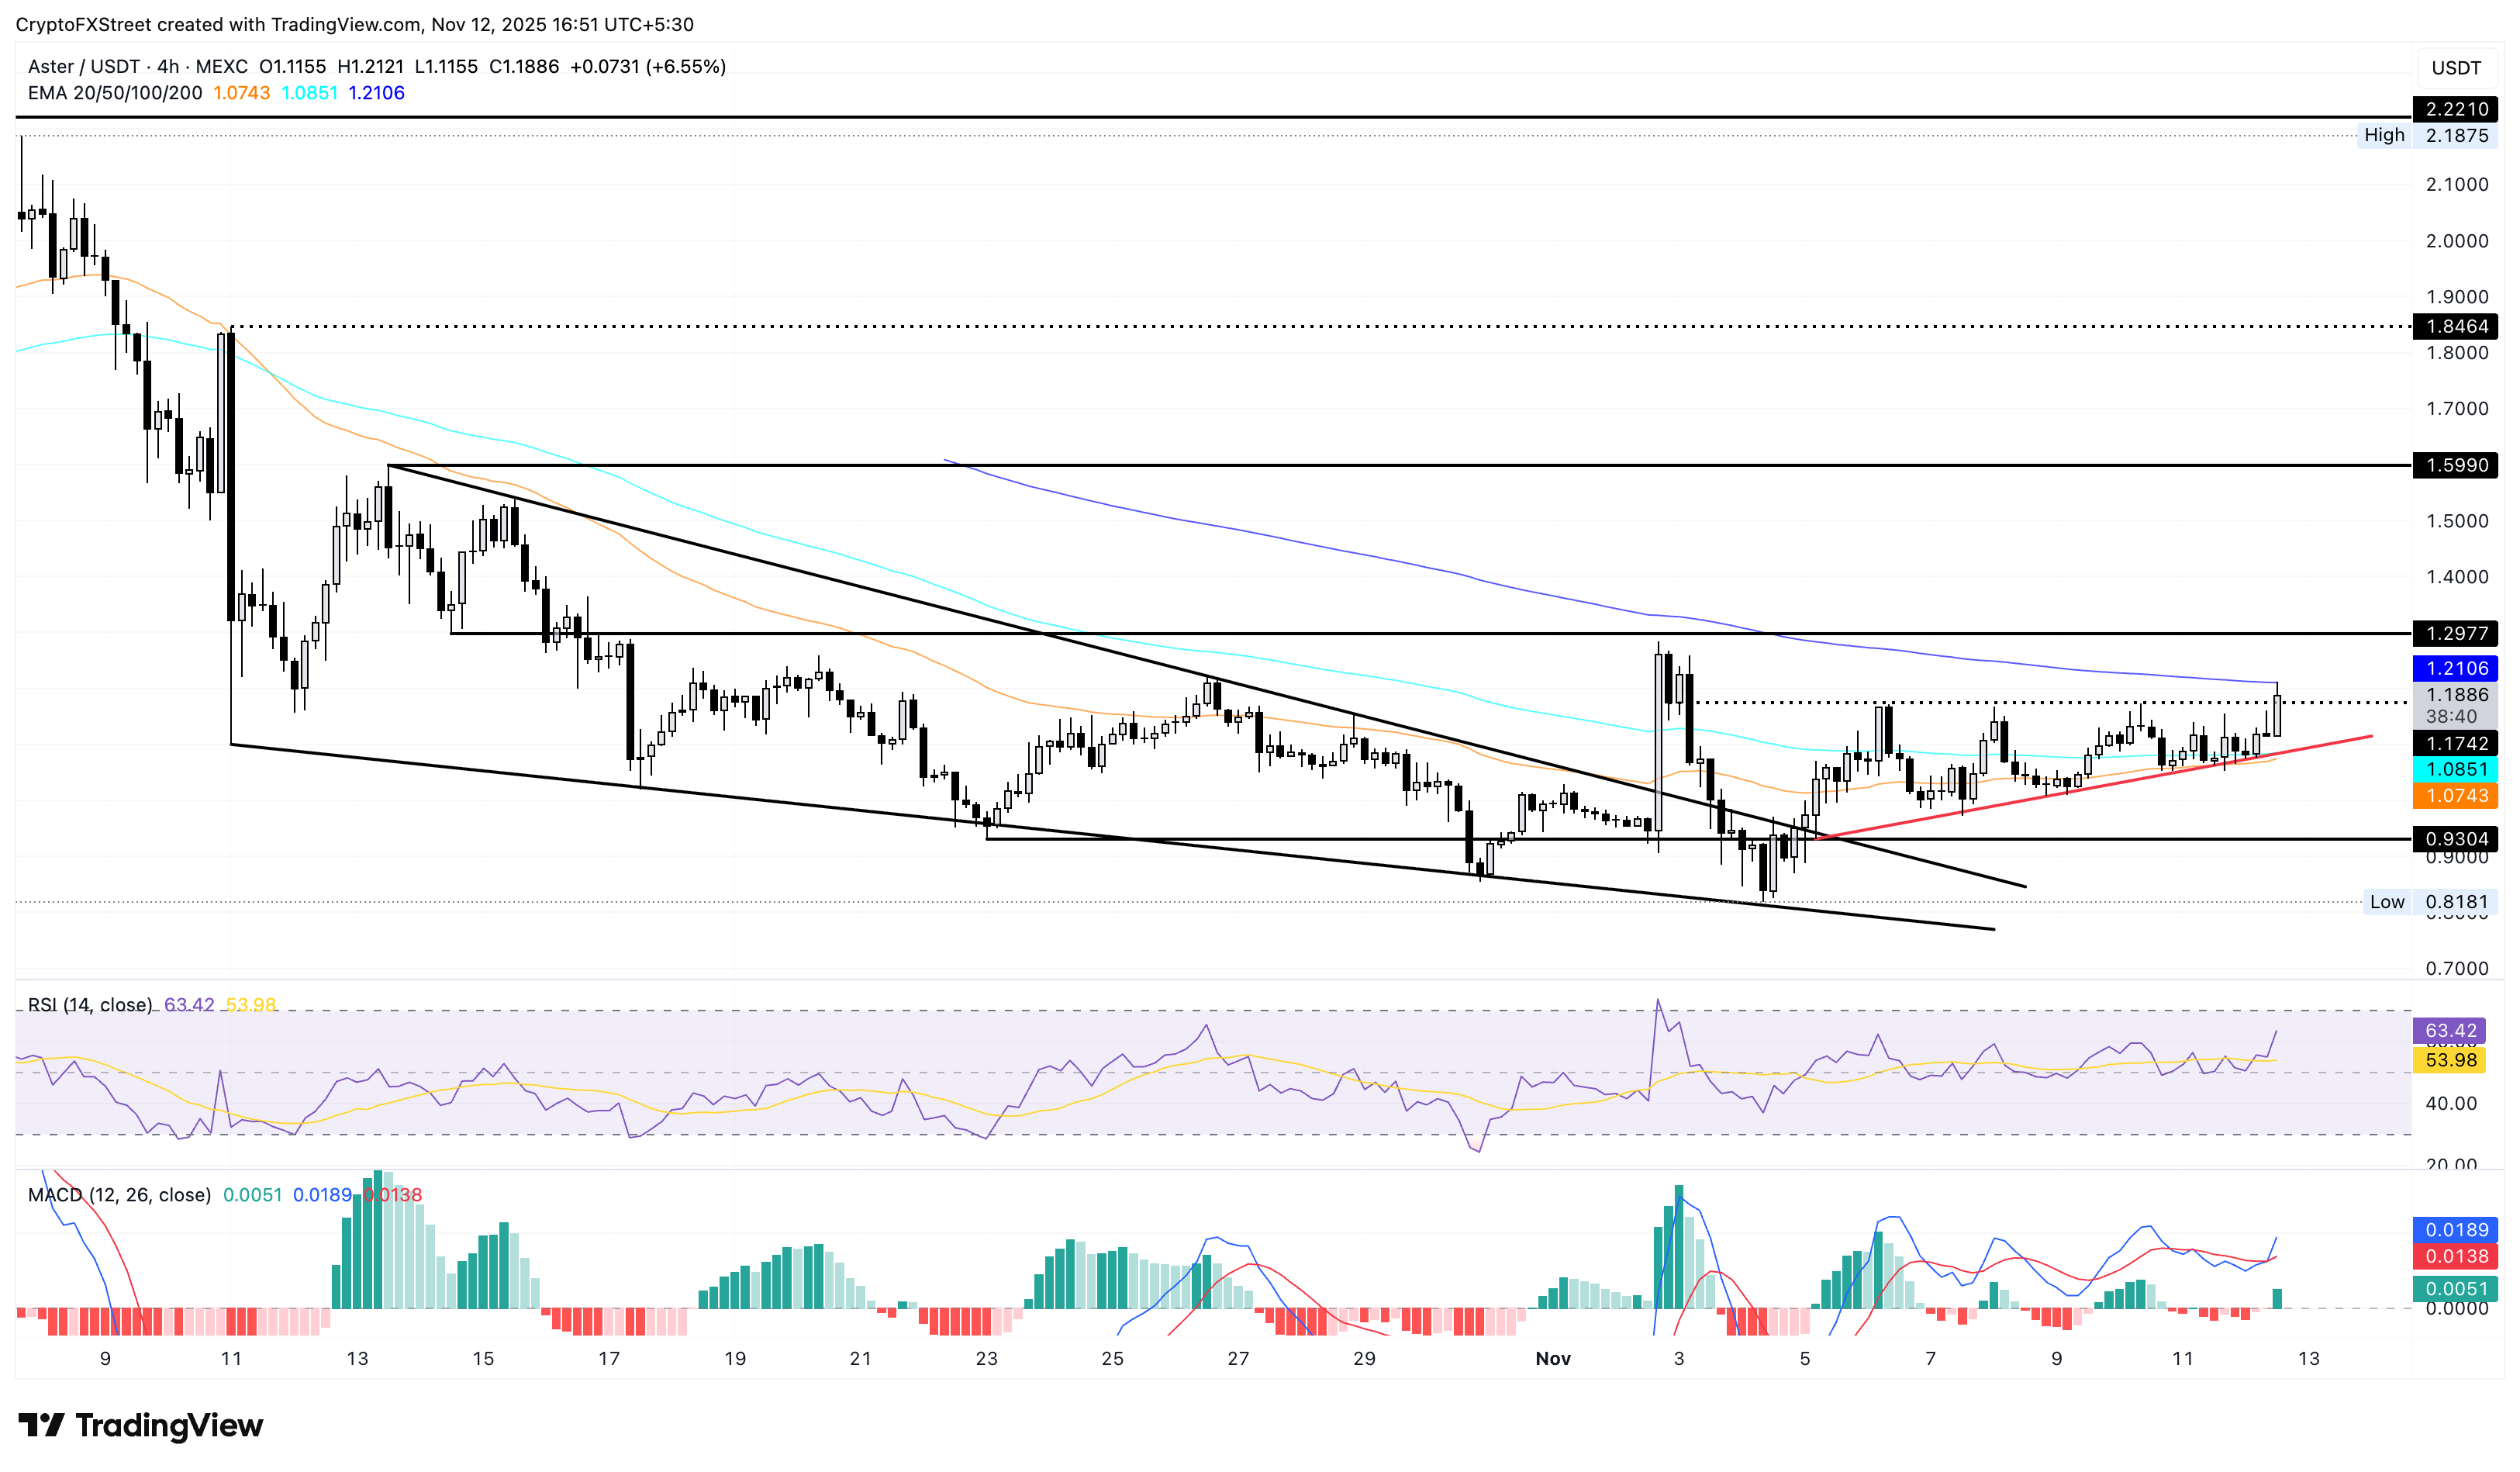
However, the short-term decline in user adoption could result in a reversal in the DEX token. So, if ASTER drops below the 50-day EMA at $1.0743, it would create a bullish trap and invalidate the ascending triangle pattern, potentially extending the decline to the October 23 low at $0.9304.
Author

Vishal Dixit
FXStreet
Vishal Dixit holds a B.Sc. in Chemistry from Wilson College but found his true calling in the world of crypto.



