Arbitrum Price Forecast: ARB ponders 50% breakout
- Arbitrum price eyes a retest and a breakout above $1.12 and $1.29 weekly hurdles.
- Clearing these levels could trigger a rally that allows ARB bulls to retest the $1.68 level.
- A daily candlestick close below the $0.94 level will invalidate the bullish thesis.

Arbitrum (ARB) price has been consolidating around the weekly hurdle for nearly a month. The recent flip of the momentum indicators into a bullish zone hints that a rally is brewing for ARB.
Also read: Arbitrum price veers as hard fork proposal receives 99.84% votes in favor
Arbitrum price edges closer to a breakout
Arbitrum price tagged the $1.12 resistance level a few times in early November but failed to break out and sustain above it. The recent attempt on December 4 was rejected, but the subsequent correction was short-lived. During this process, the Relative Strength Index (RSI) and the Awesome Oscillator (AO) have both flipped above their respective mean levels of 50 and 0, suggesting that the bullish momentum is sustainable.
So a successful breakout above the $1.12 level could trigger Arbitrum price to rally 13% and tag the next key weekly barrier at $1.28. However, if buyers flip the second key weekly hurdle into a support level, it would be a buy signal.
In such a case, Arbitrum price could kickstart a 32% upswing to $1.68. This move would constitute a 50% rise from the $1.12 barrier, and is likely where the altcoin would consolidate before making its next move.
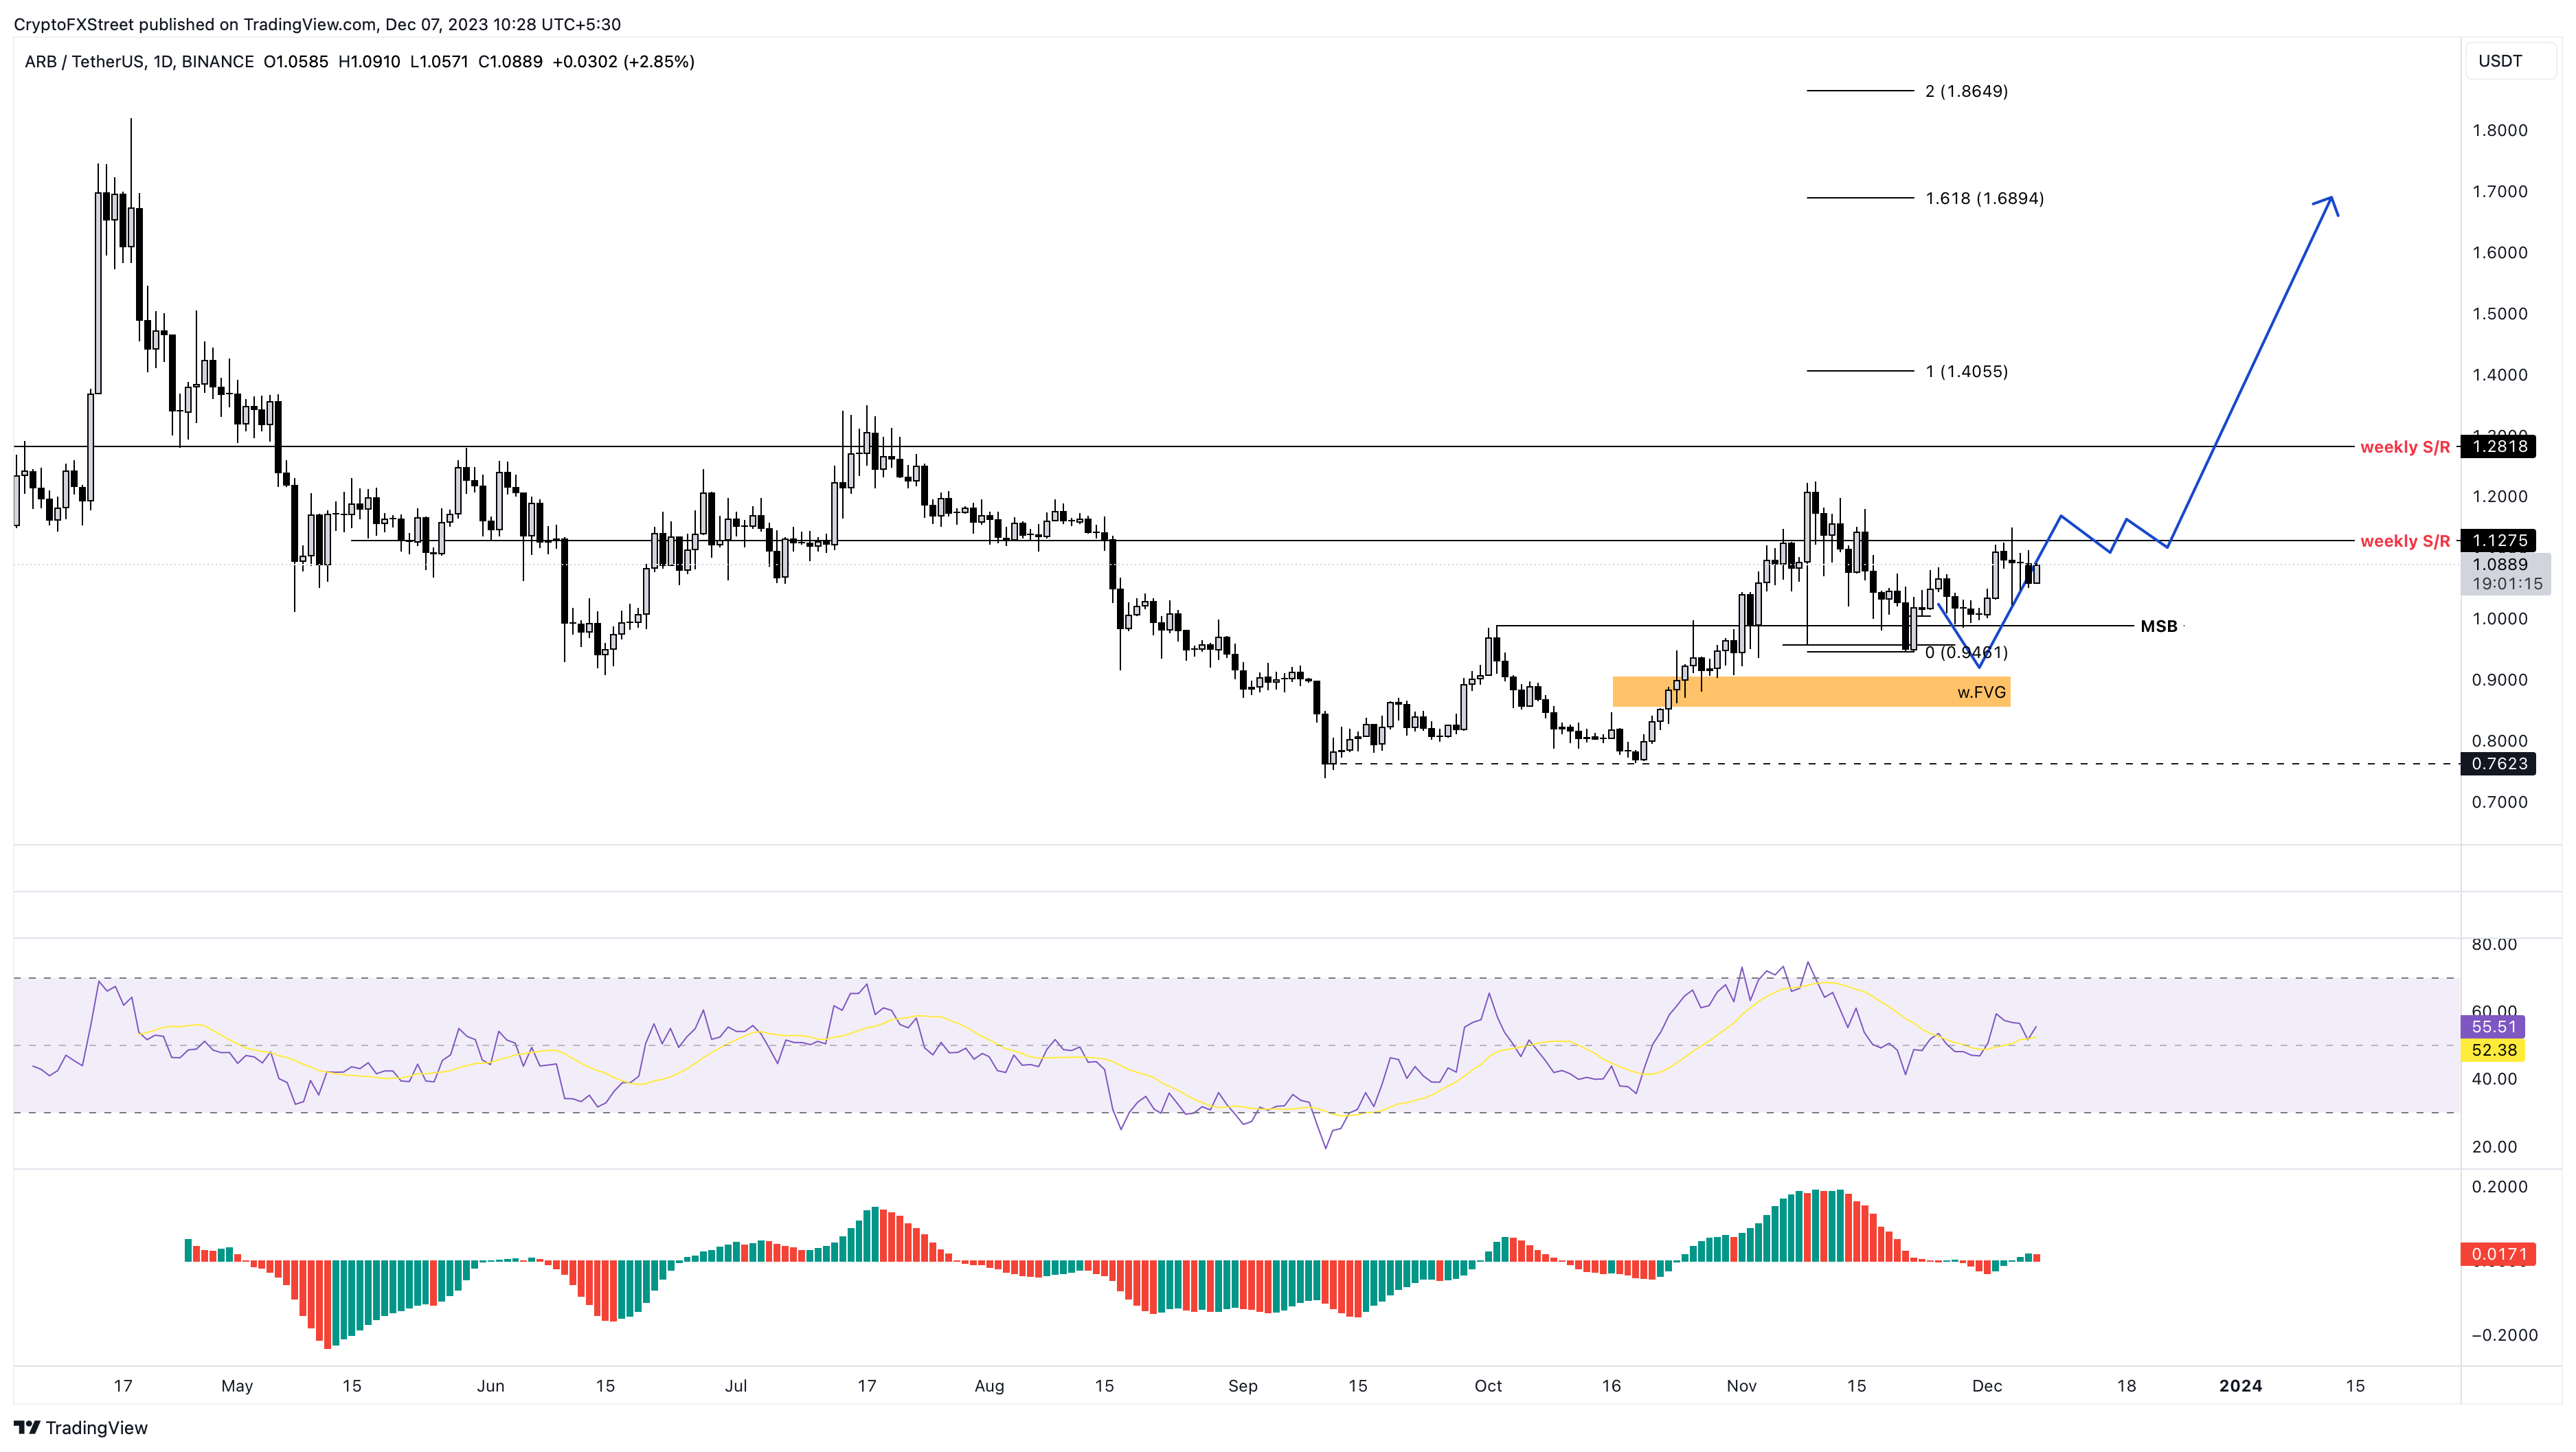
ARB/USDT 1-day chart
While the outlook for Arbitrum price looks bullish, investors need to watch for a daily candlestick close below the $0.94 level. This move will create a lower low and invalidate the bullish thesis. In such a case, ARB could head lower to rebalance the $0.85 to $0.90 imbalance. A failure from bulls to step in here could further drive Arbitrum price down to the $0.76 support level.
Read more: Four on-chain metrics suggest Arbitrum’s ARB could be the next Layer 2 token to breakout
Author

Akash Girimath
FXStreet
Akash Girimath is a Mechanical Engineer interested in the chaos of the financial markets. Trying to make sense of this convoluted yet fascinating space, he switched his engineering job to become a crypto reporter and analyst.




