ApeCoin Price Prediction: APE showing signals every bear wants to see
- ApeCoin price closed last week with 8% net positive returns.
- Bears in the shorting APE maybe aiming for last week's low at $4.48.
- Risk to the downside would be invalidated by a breach above $5.99.

ApeCoin price shows evidence to consider that a pullback will occur. Risk management should be advocated moving forward, as the recent uptrend has been volatile and powerful in its own right.
ApeCoin price showing reversal signals
ApeCoin price shows the first signals of an exhausting trend as the price faces resistance from the $6 boundary. Last week the APE price rose by 16%, but profit-taking bears entered the market last minute, forging a weekly settle at $5.54 with 8% net positive returns. Now as price auctions just above the weekly settle, there are technical cues hinting that bulls in the market may face a much stronger challenge.
APE price currently auctions at $5.62. The Relative Strength Index (RSI), an indicator used to forecast future market swings by assessing previous trends, shows a sell-signal that is hard to avoid amongst classical technical analysts. The uptrend has shown several bearish divergences as the price of APE ascended from $5 to $6. The bearish divergence usually indicates that a trend is beginning to lose steam. However, they are commonly found in overbought territory above 70, as was the case for the APE price on January 11 when it reached the $5 zone.
On January 14th, the Ethereum-based NFT token made a new monthly high at $5.50 with a slight diversion on the RSI, still trending in overbought conditions above 80. On January 21, APE rallied once more, marking a high at 5.99. This time the RSI showed a much stronger divergence as the move failed to break above the previous resistance zone at 70.
The RSI’s reading under 70 with divergence is a strong sell signal. If the market is genuinely overbought, traders who entered the market last week could face a challenge. This means buyers who participated in the weekly low at $4.48 are at risk of liquidation. The bearish scenario would result in a 20% decline from the current ApeCoin price.
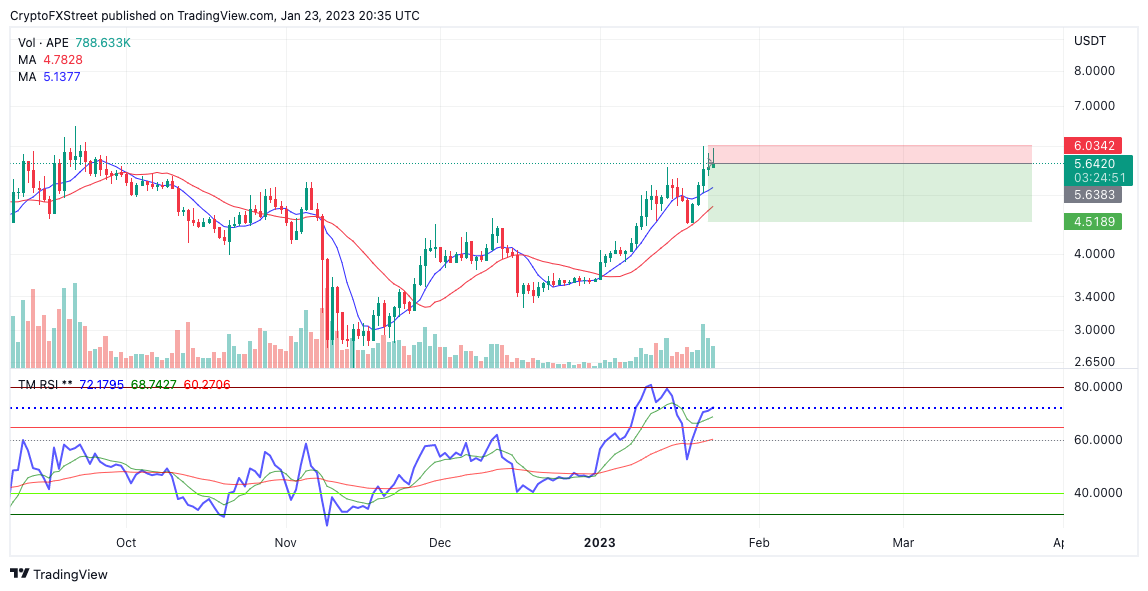
APE/USDT 1-day chart
Invalidation of the bearish trade thesis could occur if the bulls managed to breach the last week’s high at $5.99. In doing so, the price could rally higher to challenge the September high at $6.47. ApeCoin price would rise by 15% if the bulls were to succeed
Author

Tony M.
FXStreet Contributor
Tony Montpeirous began investing in cryptocurrencies in 2017. His trading style incorporates Elliot Wave, Auction Market Theory, Fibonacci and price action as the cornerstone of his technical analysis.



