ApeCoin price must regain $15 to maintain bullish trend
- ApeCoin price continues to struggle despite a broader crypto recovery.
- Whipsaws and volatility generate significant anxiety for bulls and bears.
- Two new trade opportunities are now present on APE’s Point and Figure chart.

ApeCoin price action continues to drift lower and lower, with little evidence of an impending uptrend. However, little evidence of a broad sell-off exists either. Where the Japanese candlestick charts fail to give clarity due to too much noise, Point and Figure provides the necessary clarity.
ApeCoin price action develops two powerful trade opportunities, one for the bulls and one for the bears
ApeCoin price now has two trade setups on the $0.20/3-box reversal Point and Figure chart. Both are based on the Pole Pattern in Point and Figure charting.
The hypothetical long entry for ApeCoin price is a buy stop order at $13.30, a stop-loss order at $12.60, and a profit target at $16.80. The trade represents a 5:1 reward for the risk. The setup is based on the entry from a Point and Figure pattern known as a Pole Pattern, a bullish variant. A Pole Pattern is any column with at least five Os below the multiple bottom but no more than fifteen Os total in the column. The entry is at 50% of the range of the O-column.
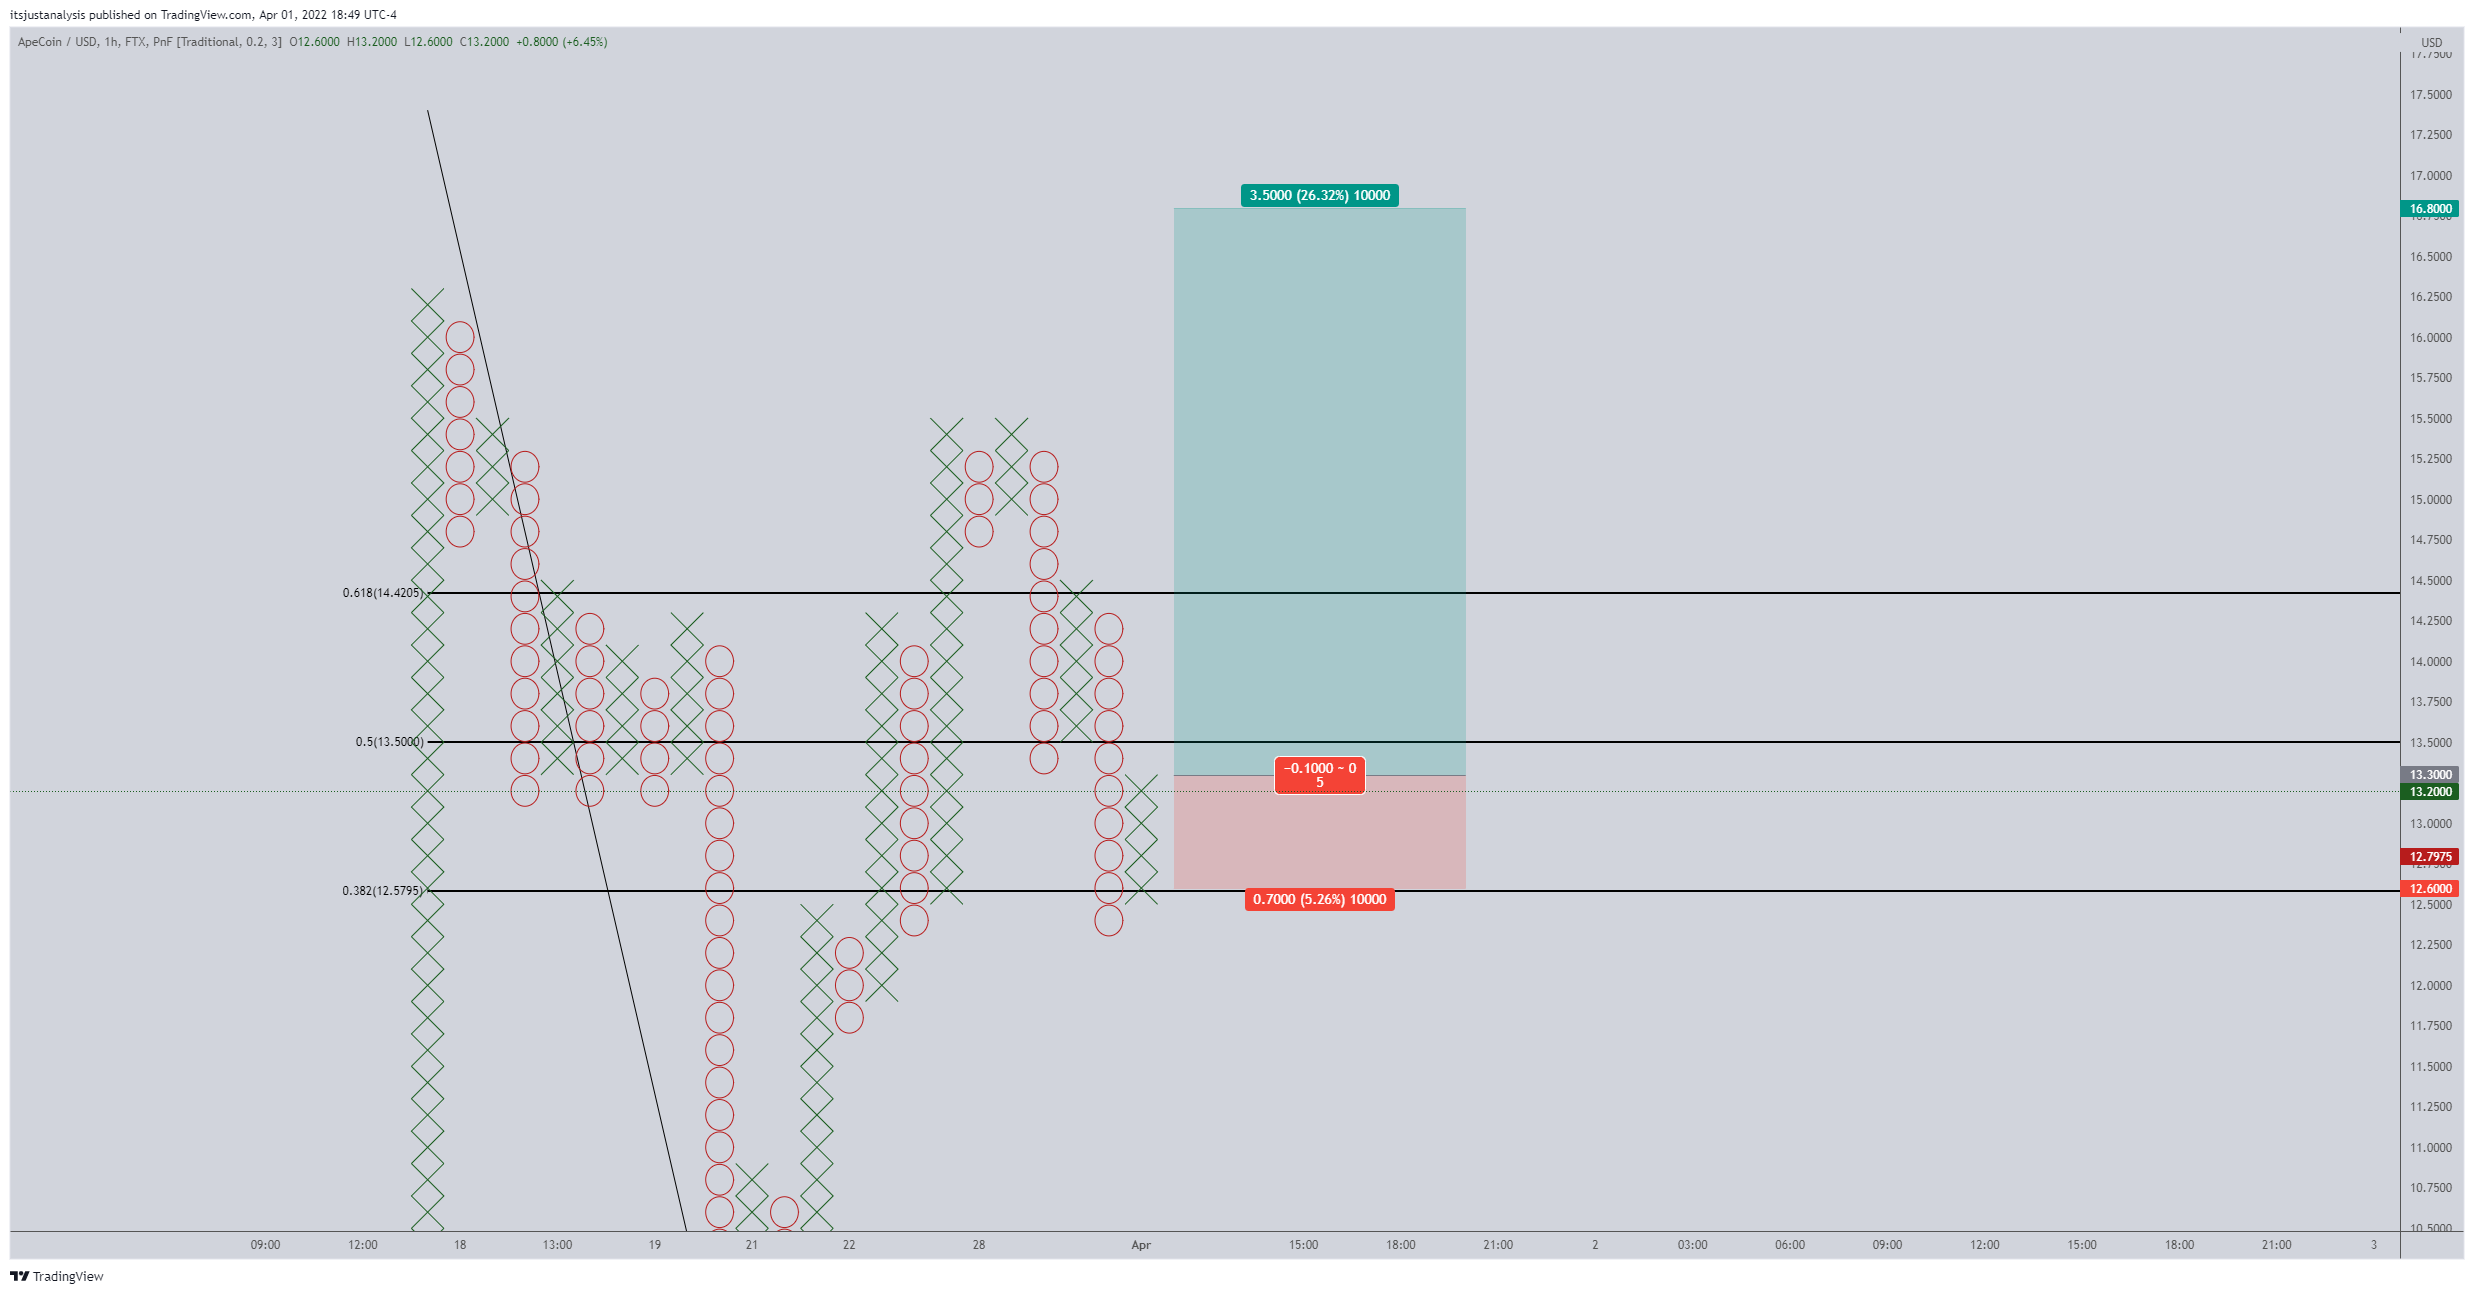
APE/USDT $0.20/3-box Reversal Point and Figure Chart
A two to three-box trailing stop for ApeCoin price would help protect any profit made post entry. The hypothetical long idea is invalidated if a new column of Os prints before the entry is triggered.
On the sell-side of the trade, a theoretical short setup for ApeCoin price exists with a sell stop order at $12.60, a stop loss at $13.40, and a profit target at $9.20. This trade idea has a 4.25:1 reward for the risk with an implied profit target of nearly 27% from the entry. Like the hypothetical long setup, the short idea is also based on a Pole Pattern. However, in this case, the short entry is immediately on the three-box reversal – but only if the current X column fails to hit the 50% level.
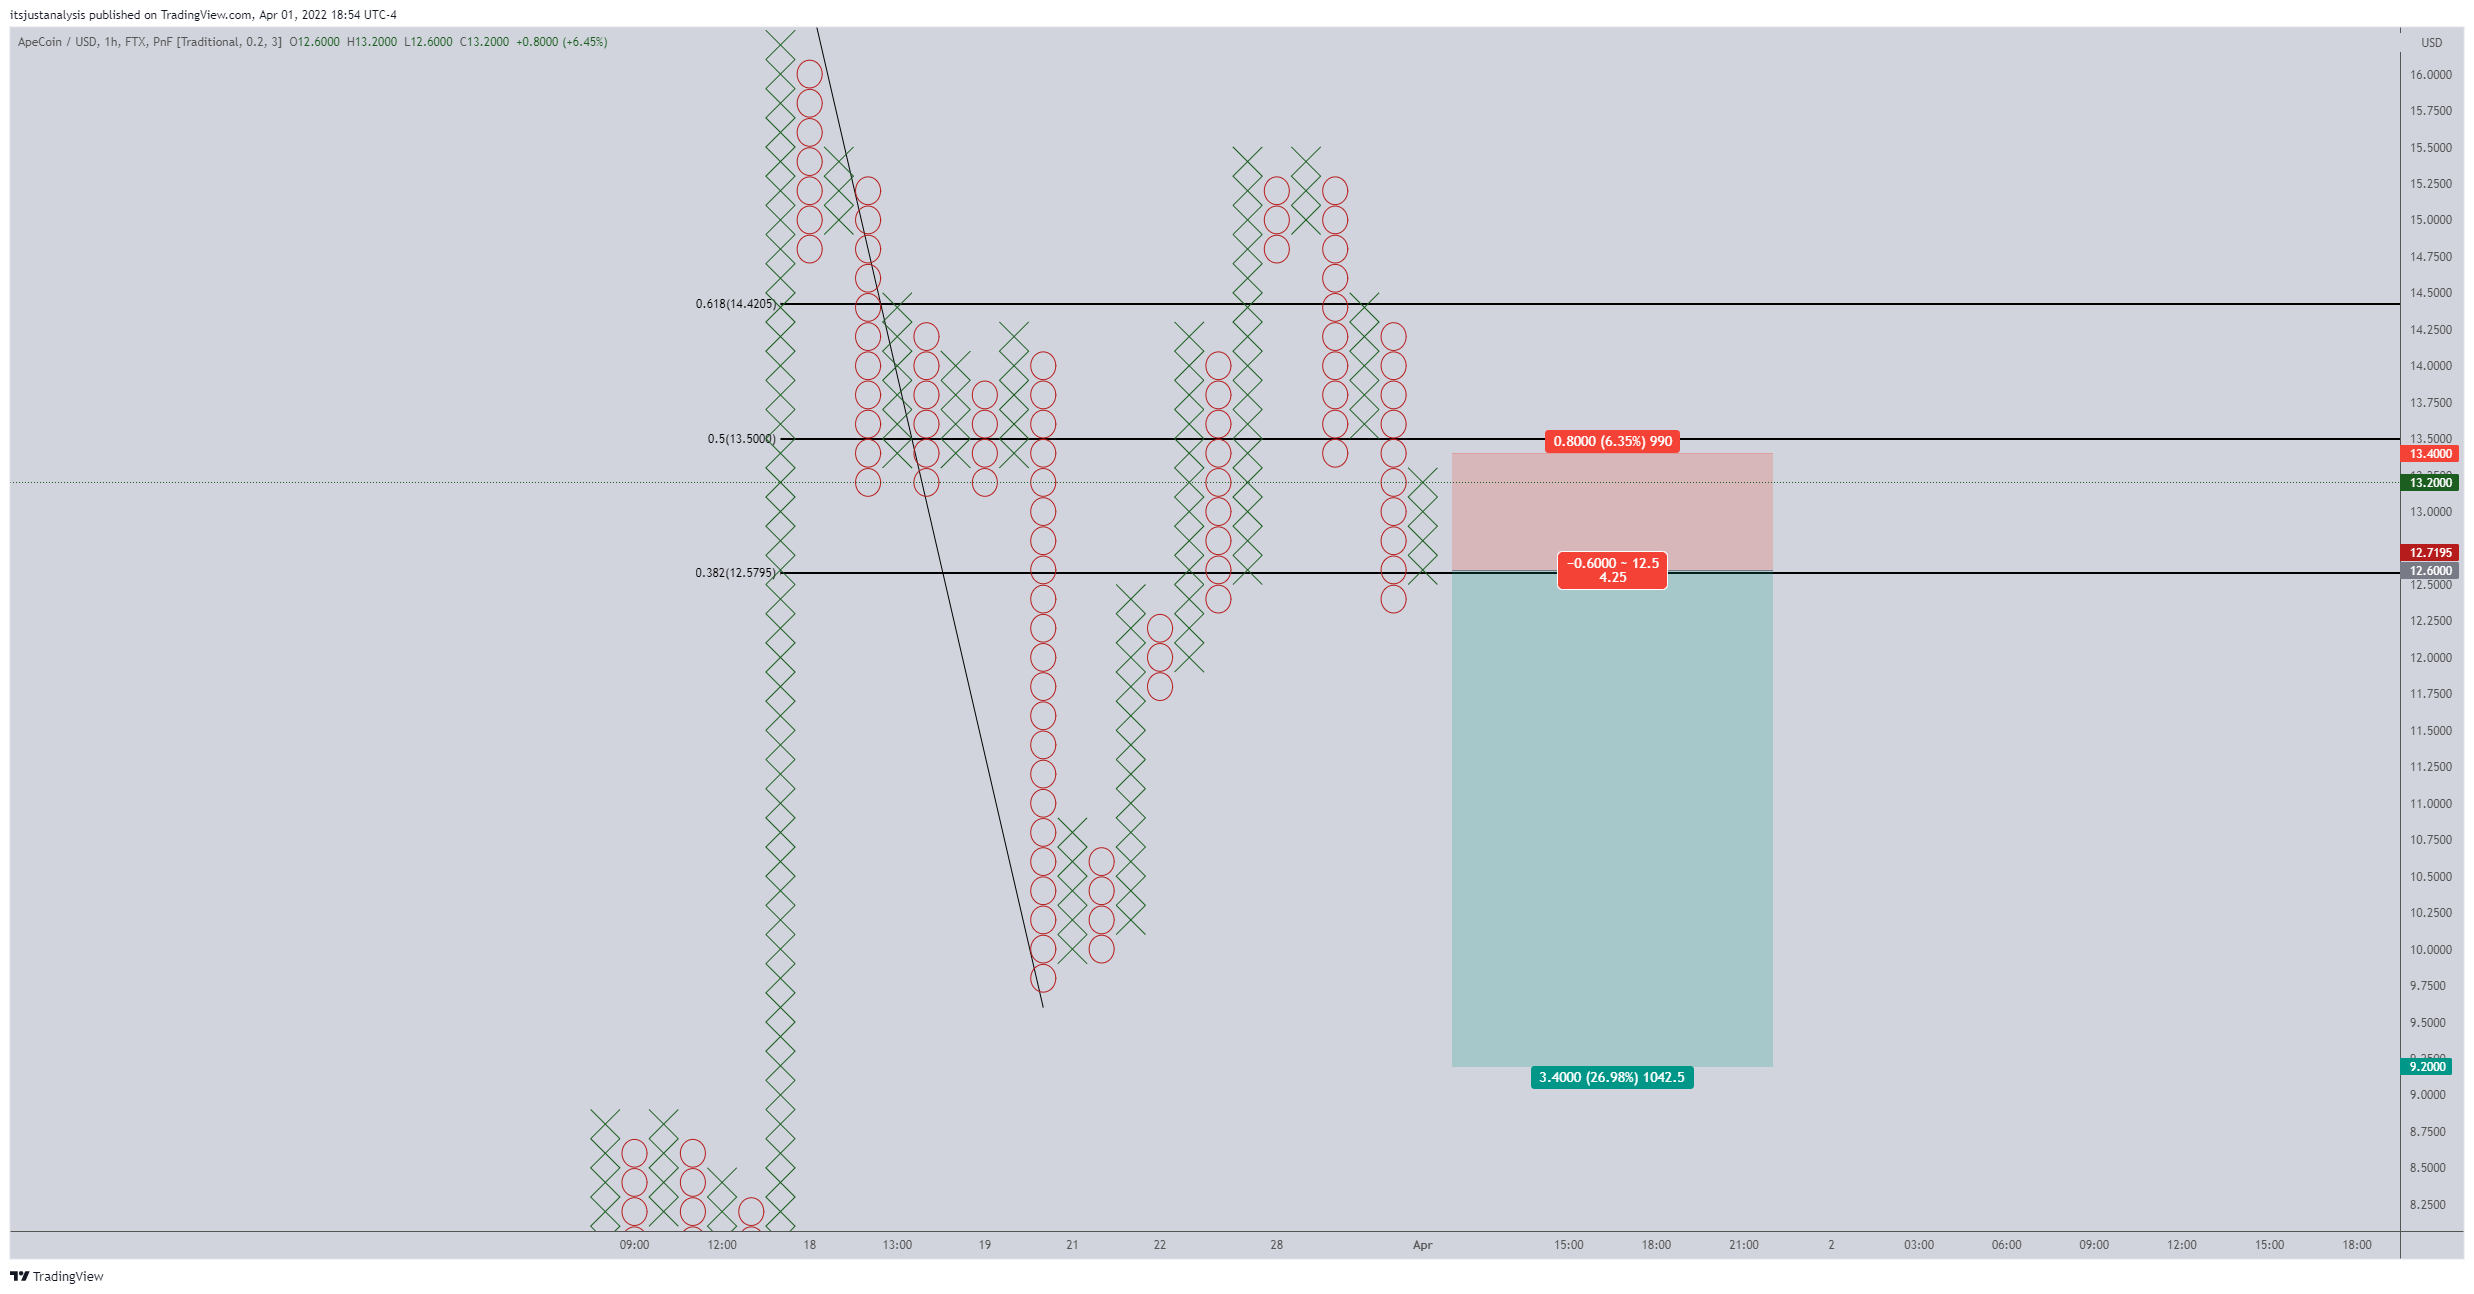
APE/USDT $0.20/3-box Reversal Point and Figure Chart
The short idea is invalidated if the hypothetical long entry triggers first.
Author

Jonathan Morgan
Independent Analyst
Jonathan has been working as an Independent future, forex, and cryptocurrency trader and analyst for 8 years. He also has been writing for the past 5 years.


