Altcoins Tron and Toncoin Price Prediction: TRX and TON show signs of weakness
- Tron and Toncoin prices extend the decline on Thursday after falling more than 6% this week.
- TRX and TON face rejection from key levels, suggesting double-digit cash ahead.
- Traders should be cautious as both altcoins show signs of weakness in momentum indicators.

Tron (TRX) and Toncoin (TON) prices extend their decline on Thursday after falling more than 6% this week. TRX and TON prices faced rejection from key levels, suggesting double-digit cash ahead. Furthermore, the technical outlook also supports a bearish trend as both altcoins show signs of weakness in momentum indicators.
Tron Price Forecast: Poised for a double-digit crash
Tron price faced rejection at the 61.8% Fibonacci retracement on Tuesday (drawn from the November 7 low of $0.159 to the December 4 high of $0.450) at $0.270 and declined 6.67% until Wednesday. At the time of writing on Thursday, it trades down around $0.244, below its 50-day Exponential Moving Average (EMA) support level of $0.248.
If TRX closes below the 50-day EMA at $0.248, it could extend the decline by 16.8% to test its December 2 low of $0.203.
The Relative Strength Index (RSI) reads 42, below its neutral level of 50, and points downwards, indicating strong bearish momentum. Additionally, the Moving Average Convergence Divergence (MACD) indicator also shows a bearish crossover on Tuesday, suggesting a sell signal and a downtrend.
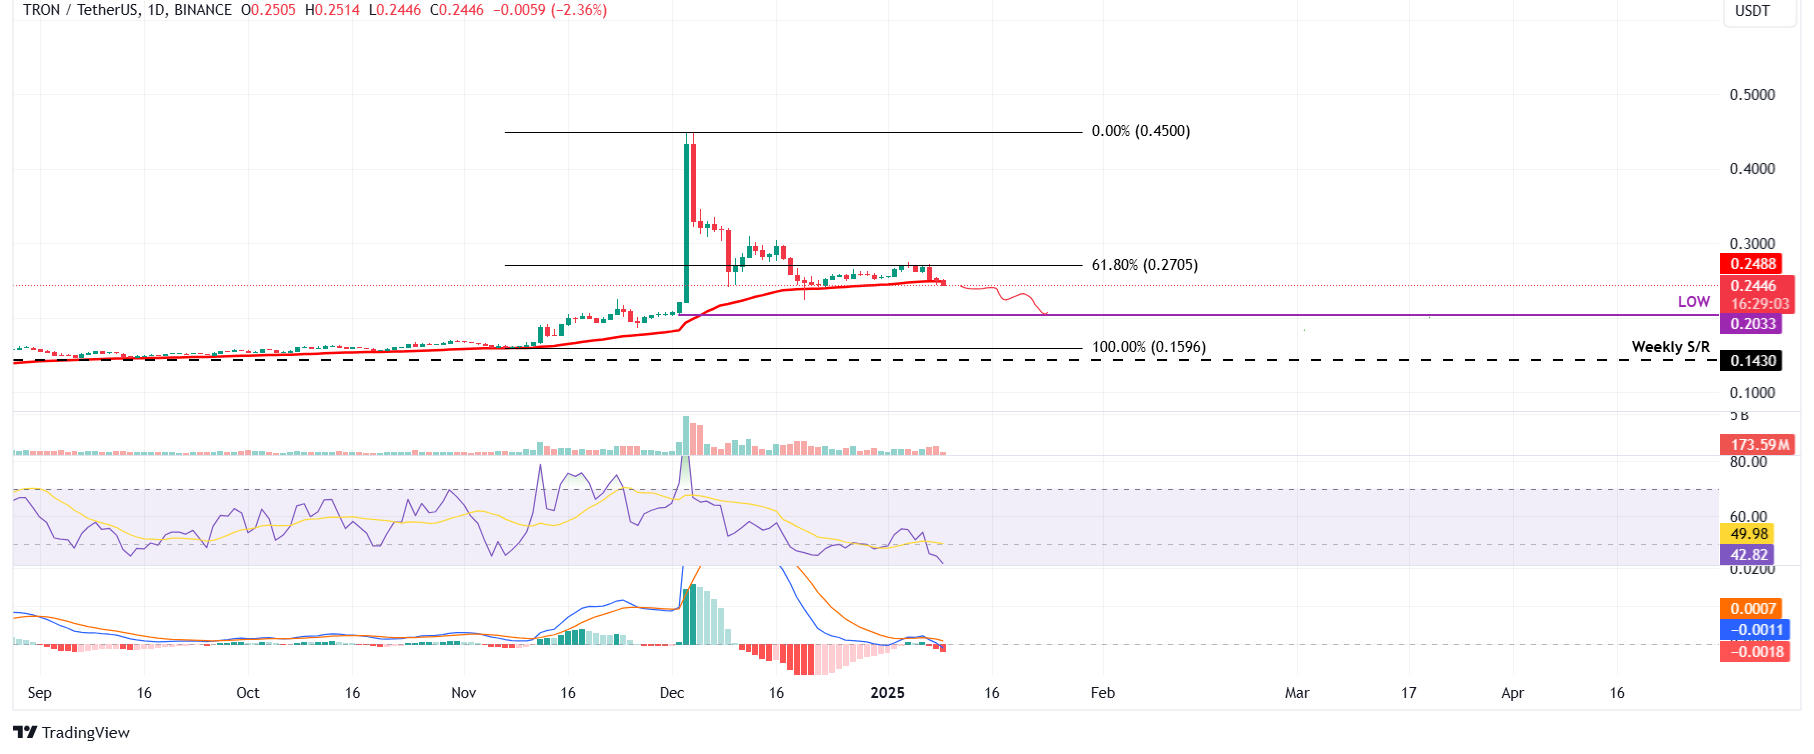
TRX/USDT daily chart
Toncoin price action shows signs of bearish momentum
Toncoin price was rejected from the 50-day EMA level of $5.72 on Tuesday and declined by 7% until Wednesday. At the time of writing on Thursday, it continues to edge down, trading around $5.20.
If TON continues its downward trend, it could extend the decline by 11.5% from its current level to retest its next daily support at $4.60.
Like TRX, Tron’s RSI indicator trades below its neutral level of 50 and points downwards, indicating strong bearish momentum. Moreover, the MACD shows a bearish crossover on Tuesday.
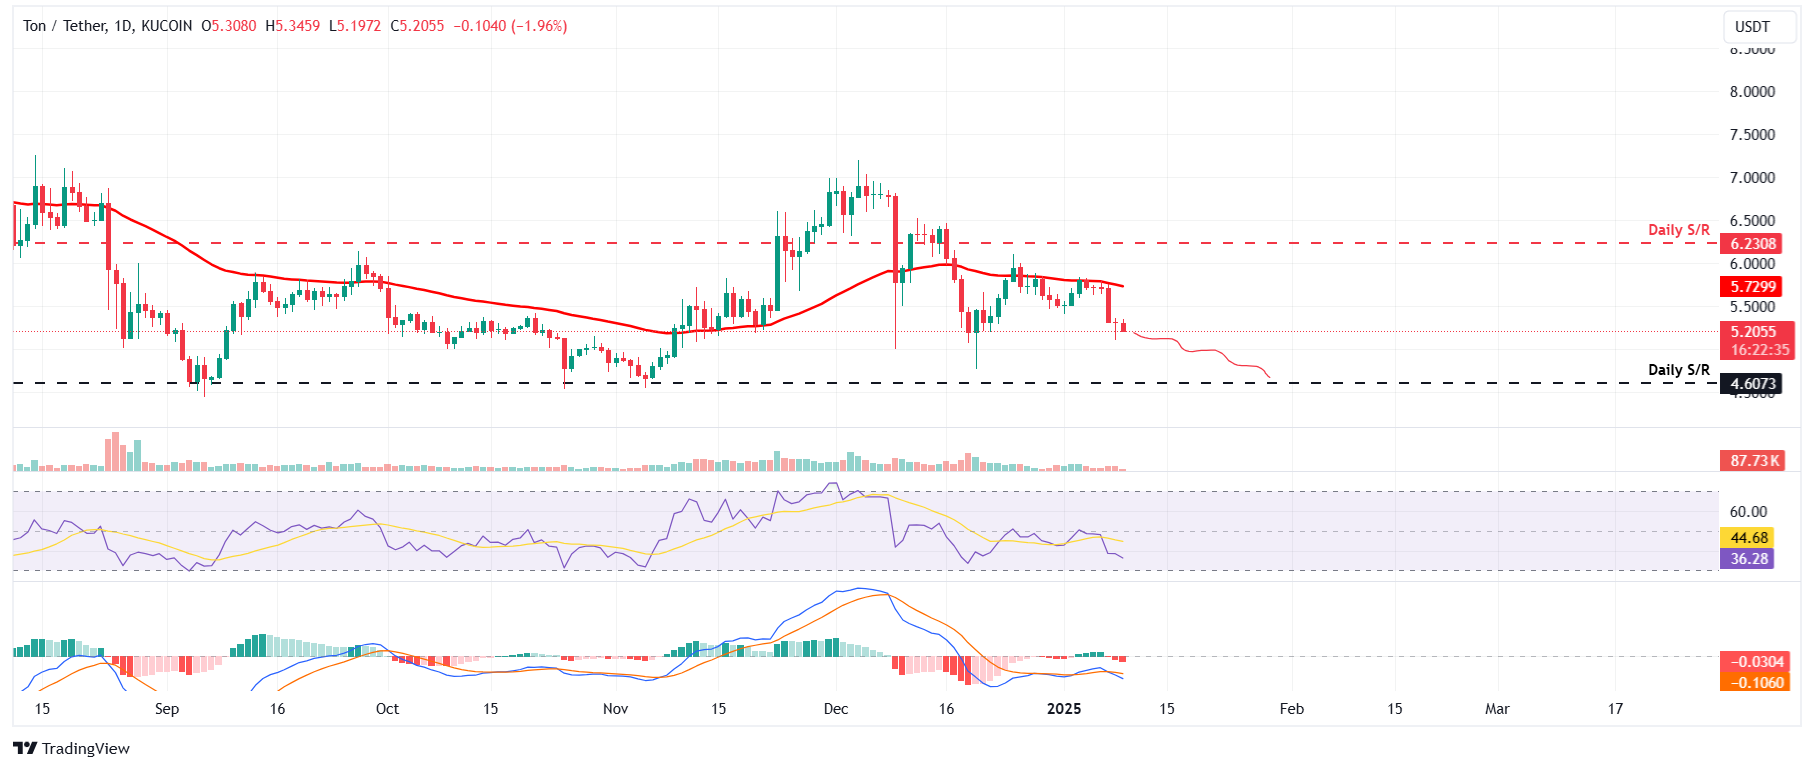
TON/USDT daily chart
Author

Manish Chhetri
FXStreet
Manish Chhetri is a crypto specialist with over four years of experience in the cryptocurrency industry.


