Altcoins in the lead: SPX, ICP, AB - Binance Alpha coins surge, ICP plans a trend reversal
- Meme coin SPX6900, part of the Binance Alpha, leads the market gains, hinting at its fourth consecutive bullish week.
- Internet Computer shares the leaderboard after a bullish weekend, hinting at a potential trend reversal.
- AB soars as Binance announces a trading competition, driving up volumes.

The cryptocurrency market begins the week on a positive note with altcoins such as SPX6900 (SPX), Internet Computer (ICP), and AB (AB) leading the gains on Monday, at press time. Recovering from the flash crash on Thursday, Bitcoin reclaims and holds above the $105,000 level on Saturday, adding tailwinds to altcoins.
However, the US-China trade talks between Treasury Secretary Scott Bessent and Vice Premier He Lifeng on Monday in London could raise the temperature in the crypto market. This is the second meeting after the talks in Geneva on May 1, which resulted in a 90-day pause in tariffs, sparking recovery in the US and cryptocurrency market over the week.
Furthermore, after a Presidential-level phone call between the US and China on Thursday last week, Donald Trump said Xi has agreed to resume shipments of rare earth minerals and magnets bound for the US.
Still, a gloomy air surrounds the second meeting, as tensions have taken a serious military turn, with US Defense Secretary Hegseth portraying China as a real and imminent threat and "credibly" preparing to use force.
SPX6900 upholds the uptrend
The meme coin SPX soared 7.95% on Sunday following the 8% hike on Saturday to complete a bullish weekend. At the time of writing, SPX trades at $1.25 with minimal intraday movement after a 22% rally last week.
The meme coin faces opposition at the 78.6% Fibonacci level at $1.28, retraced between January’s highest closing at $1.55 and March’s lowest closing at $0.29. Typically, investors with purchase costs below the 50% Fibonacci level target the 78.6% level as a profit-booking spot, increasing the downside risk.
Despite the uptrend in motion, the Relative Strength Index (RSI) at 70 hovers almost flat below the overbought boundary, reflecting a weakening in momentum. Traders must remain cautious as the near-flat RSI marks a bearish divergence with the uptrend, signalling a bearish reversal.
The crucial support for SPX remains the $1 psychological support, followed by $0.92, the 50% Fibonacci level.

SPX/USDT daily price chart. Source: TradingView
On the contrary, a daily closing above $1.28 could prolong SPX’s uptrend to January’s highest closing at $1.55.
ICP nears triangle breakout
ICP is up by nearly 6% at press time in the last 24 hours, with two consecutive bullish candles on the weekend accounting for a 12% hike. The reversal run challenges the upper boundary of a symmetrical triangle pattern, hinting at a potential breakout.
The converging trendlines formed by the peaks on February 21, March 4, and May 12, and the lows on April 7, May 6, and May 31, form a triangle pattern.
Traders should look for a daily close above the trendline or the peak on May 12 at $6.13 for a buy signal, with a potential price target at $7.22, the peak formed on March 4.
Supporting the upside chances, the Moving Average Convergence/Divergence (MACD) indicator triggers a buy signal as the blue line crosses above the red. Rising above the zero line with a fresh wave of green histograms above the same line signals a high likelihood of a potential breakout.

ICP/USDT daily price chart. Source: Tradingview
If ICP reverses from the overhead trendline, crucial support lies at $4.67, last tested on May 31.
AB crosses above the $0.010 resistance
AB, an altcoin part of the Binance Alpha, which is a pre-listing pool, has increased by over 5% in the last 24 hours at press time. Fueled by the trading competition announced by Binance on Saturday, the token surged 15% on Saturday, followed by an 11% extension on Sunday.
The uptrend has crossed above the $0.010 psychological threshold, reaching a 30-day high. The MACD and its signal lines cross above the zero line with a new wave of bullish histograms signaling rising uptrend momentum.
Traders should look out for the immediate resistance at $0.013, last tested on April 12. A potential breakout could prolong the uptrend to $0.015, last tested on March 28.
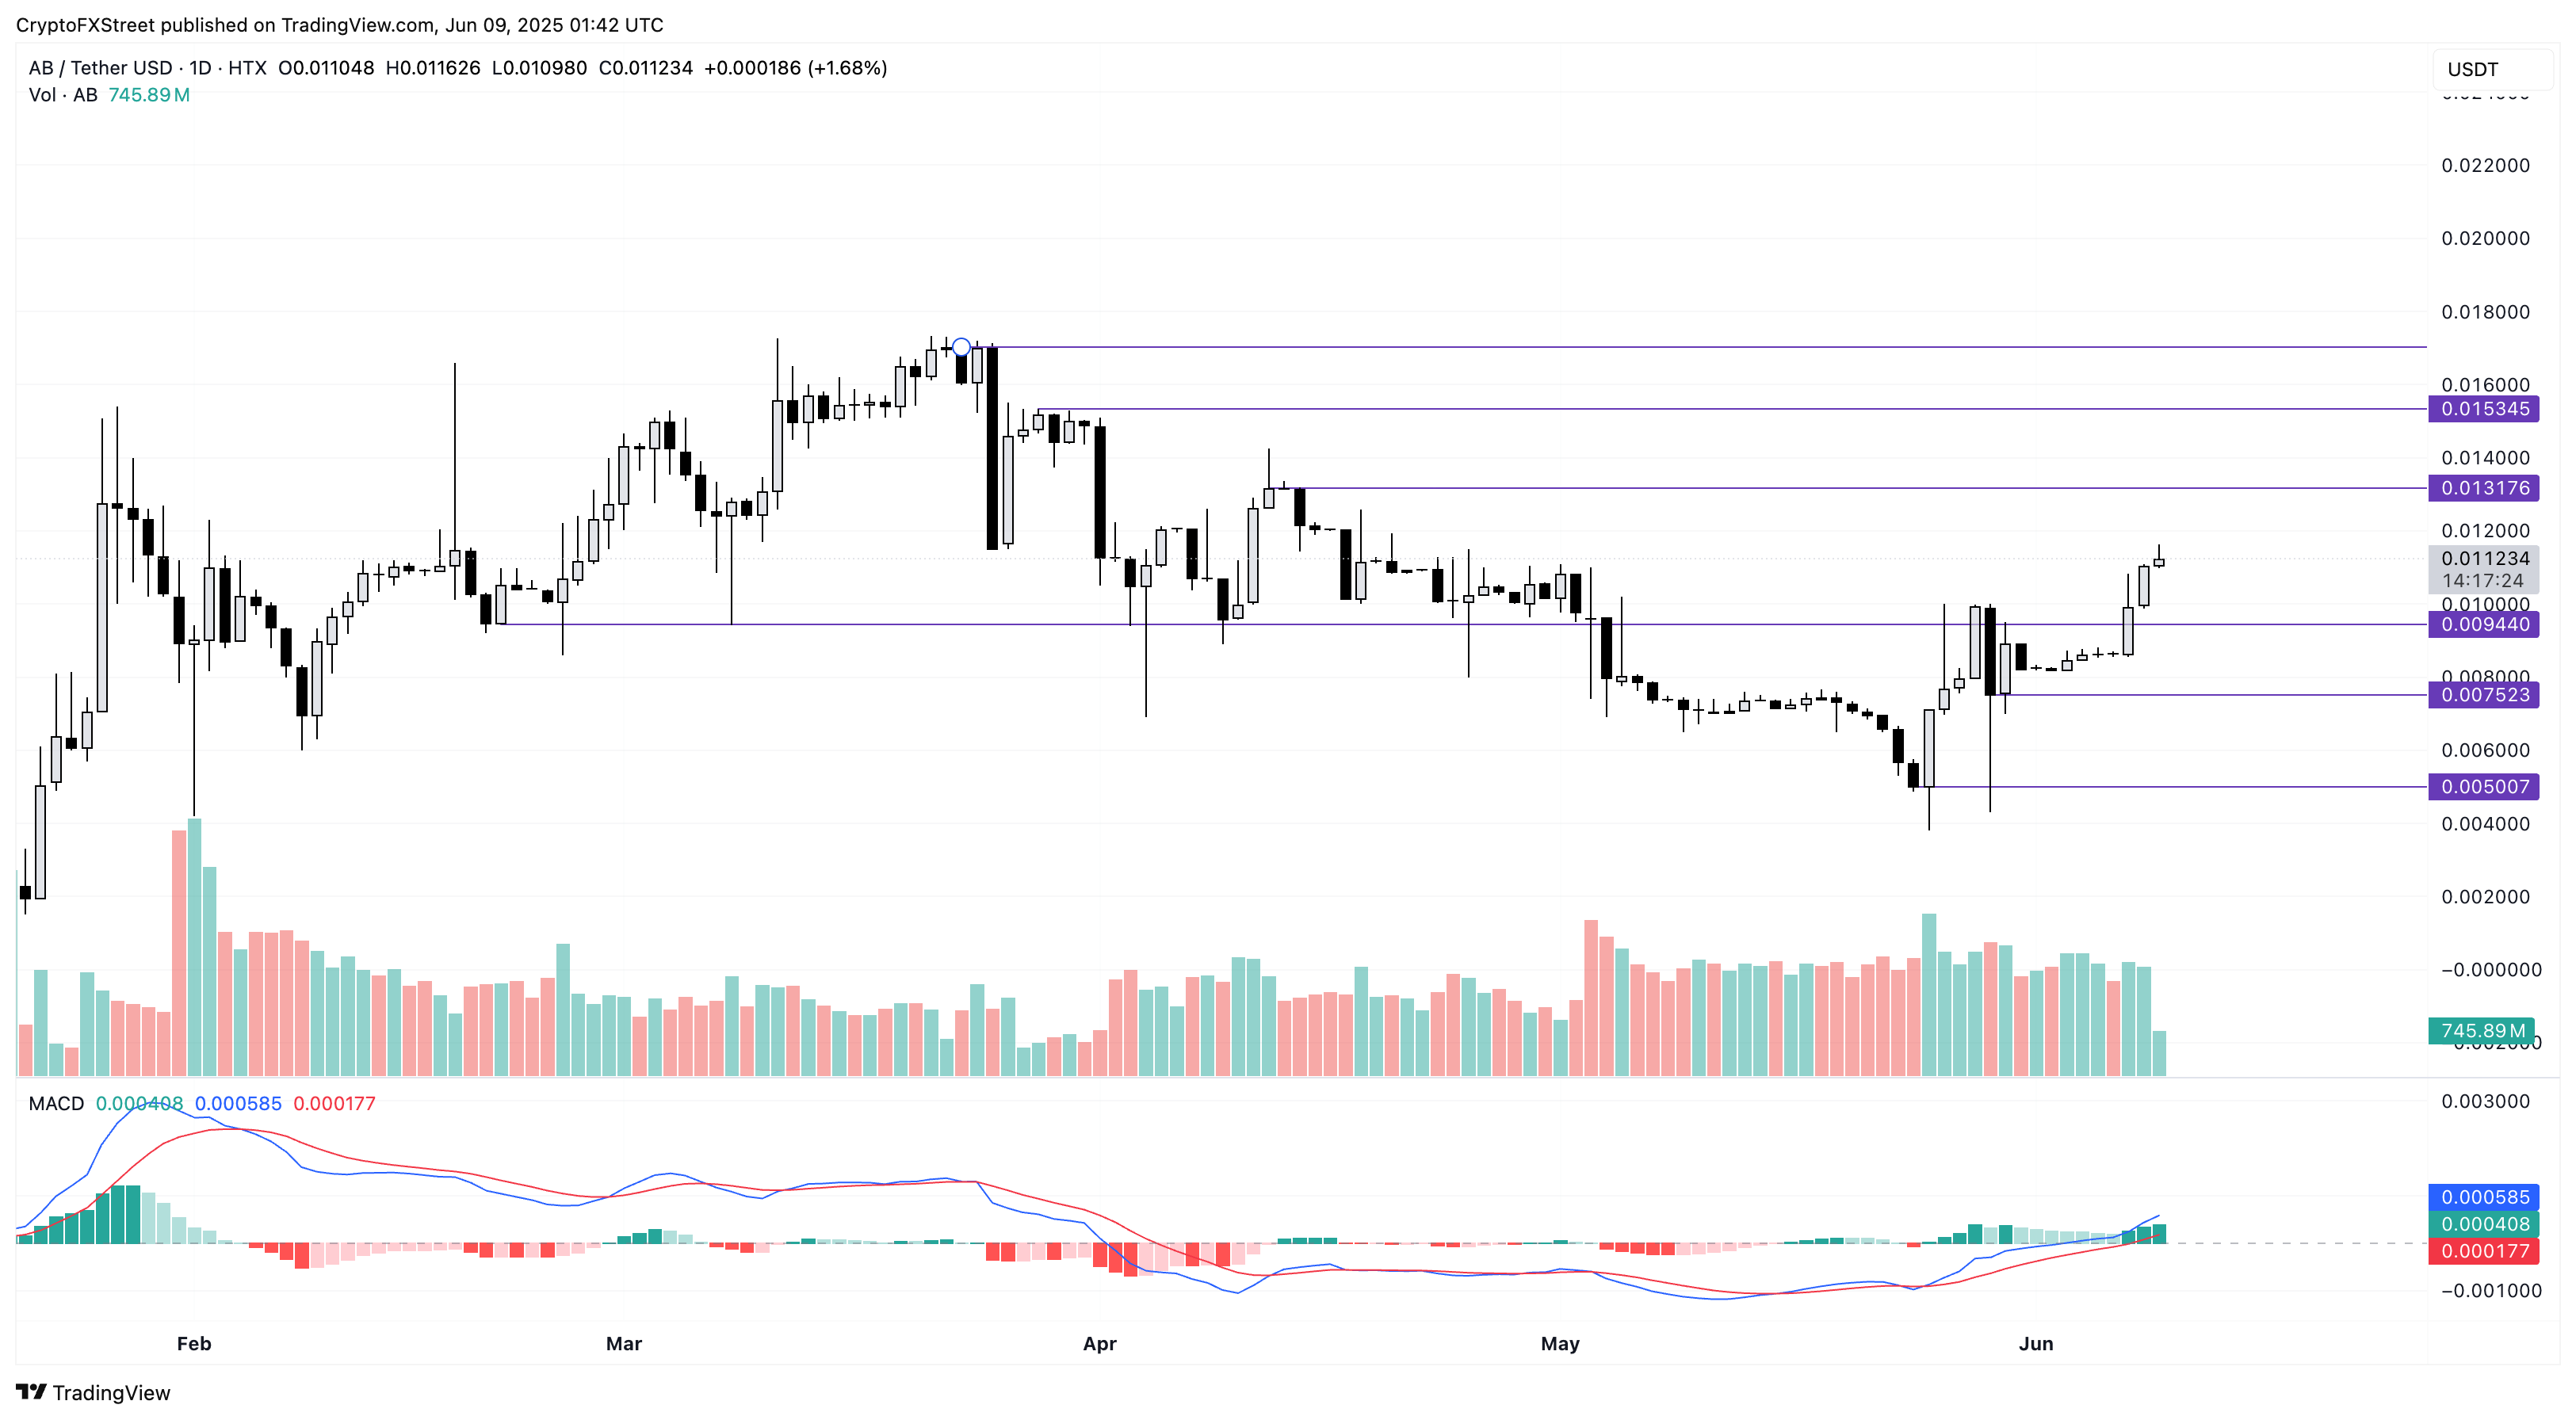
AB/USDT daily price chart. Source: Tradingview
Conversely, a flip in AB’s trend could test the $0.0094 support highlighted by the February 20 low, followed by the low on May 29 at $0.0075.
Author

Vishal Dixit
FXStreet
Vishal Dixit holds a B.Sc. in Chemistry from Wilson College but found his true calling in the world of crypto.