- Algorand price is contained inside an ascending broadening wedge pattern on the 12-hour chart.
- The digital asset must climb above a key resistance level for a massive breakout.
- Algorand momentum shifted in favor of the bears in the last week.
Algorand price had a massive rally in February and another spike on April 17 to $1.8. However, the digital asset got rejected from a key resistance trend line and is trying to hold above a significant support level.
Algorand price aims for a massive breakout
On the 12-hour chart, Algorand price has formed an ascending broadening wedge pattern that can be drawn connecting the higher lows and higher highs with two trend lines that separate from each other.
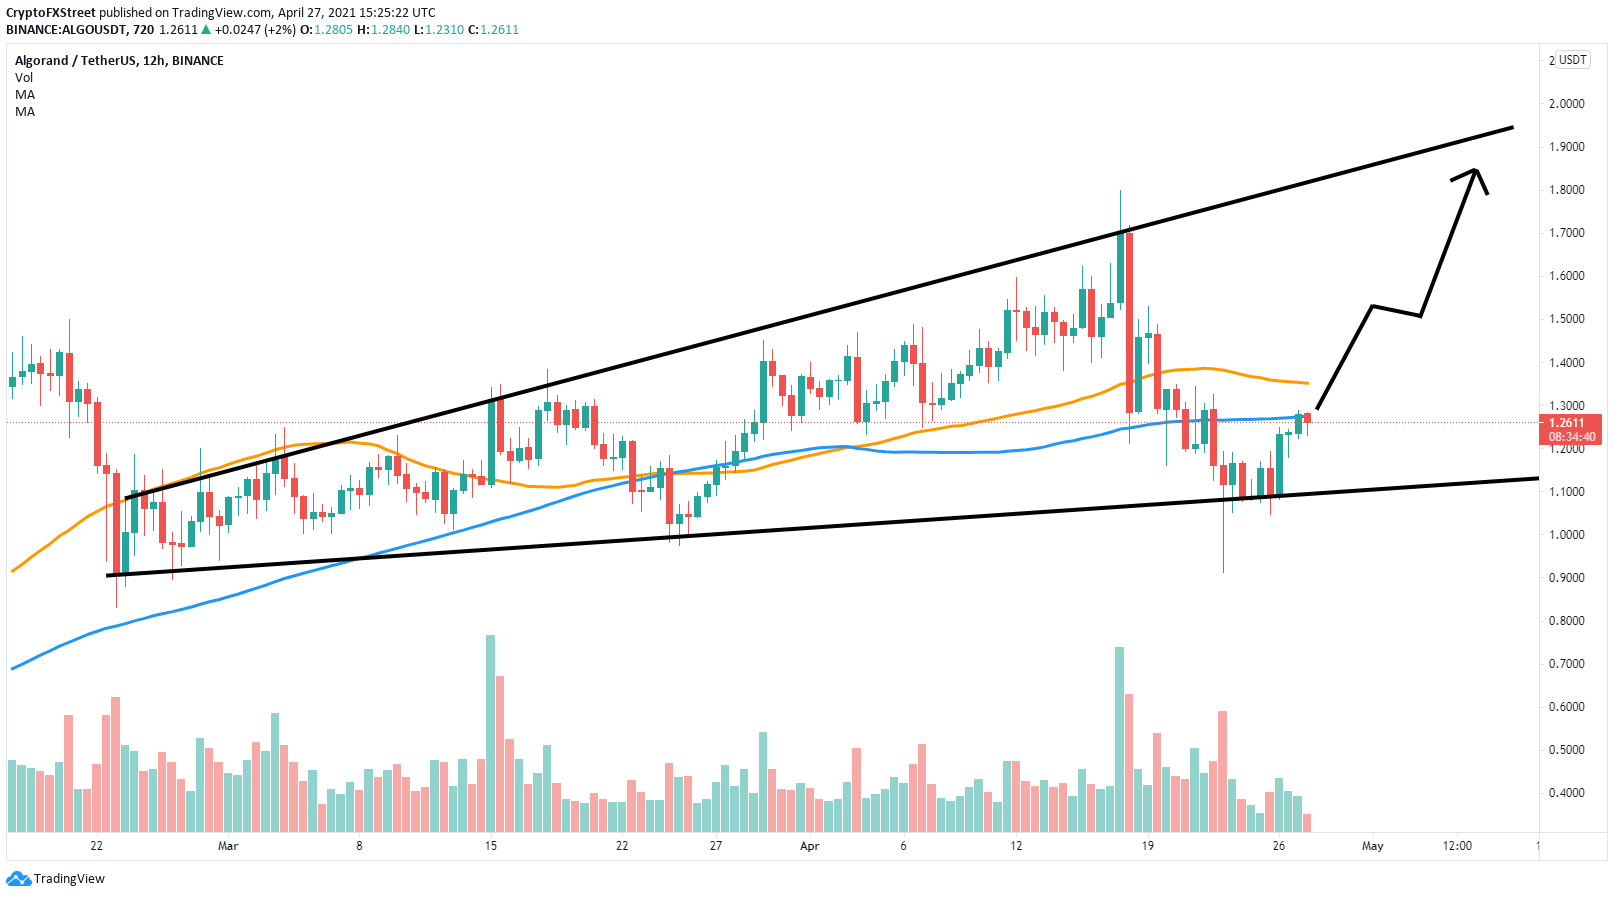
ALGO/USD 12-hour chart
There is a strong resistance area between $1.27 to $1.33 where the 50 SMA and the 100 SMA are currently located. A breakout above this point should quickly drive Algorand price toward $1.5 initially and as high as $1.9 in the longer term.
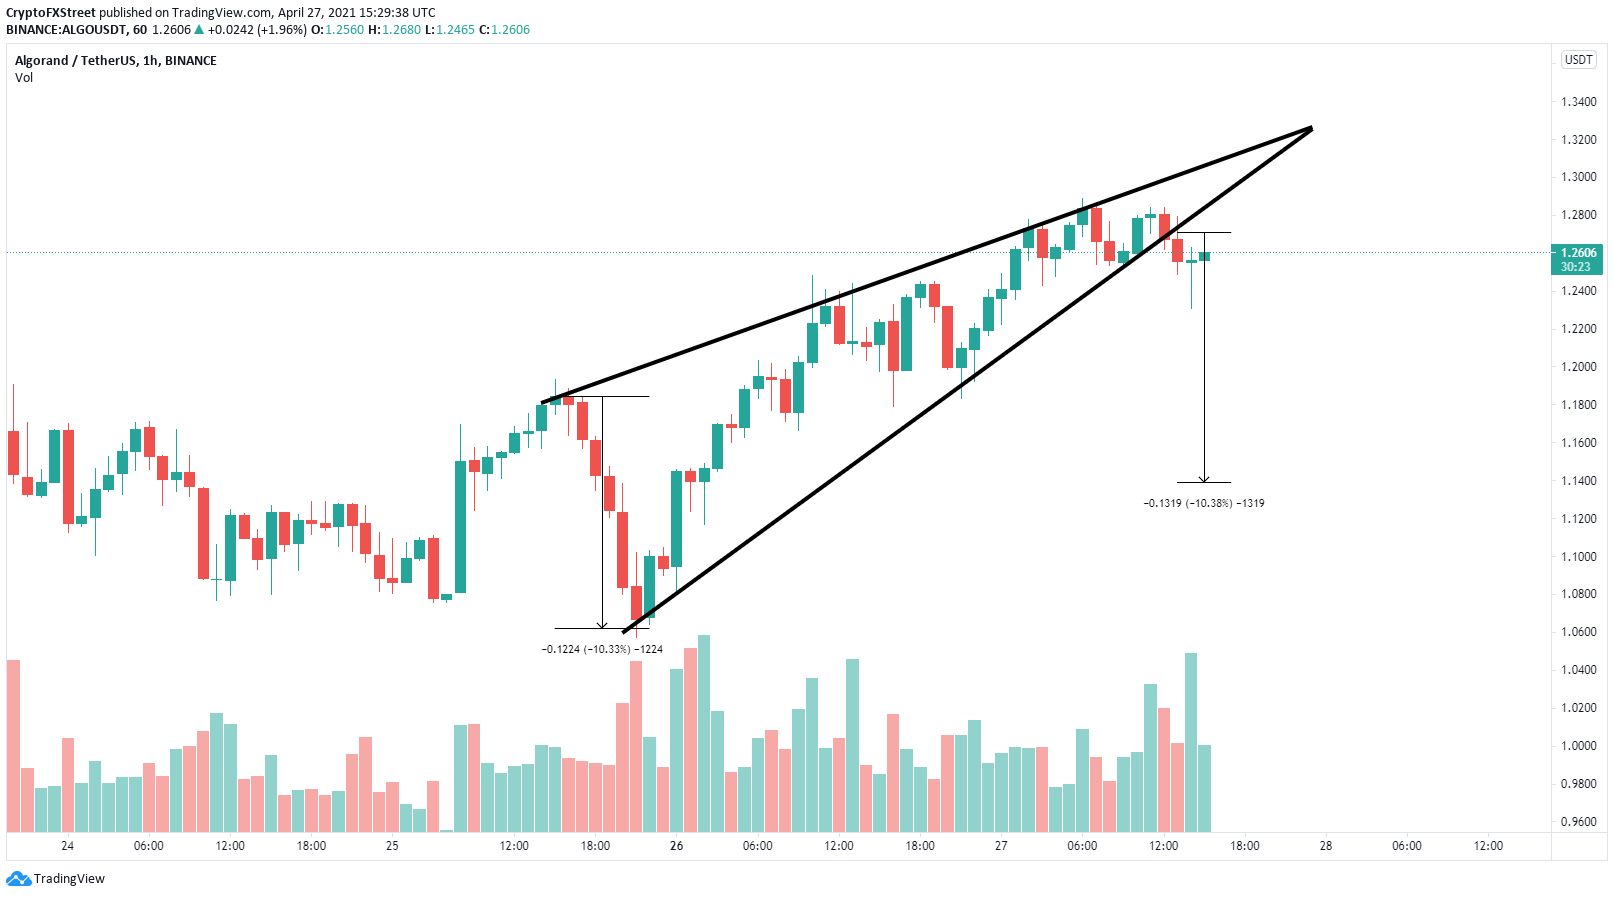
ALGO/USD 1-hour chart
However, on the hourly chart, Algorand had a breakdown from an ascending wedge pattern which has a 10% price target down to $1.14. The only support level in-between is located at $1.18.
Note: All information on this page is subject to change. The use of this website constitutes acceptance of our user agreement. Please read our privacy policy and legal disclaimer. Opinions expressed at FXstreet.com are those of the individual authors and do not necessarily represent the opinion of FXstreet.com or its management. Risk Disclosure: Trading foreign exchange on margin carries a high level of risk, and may not be suitable for all investors. The high degree of leverage can work against you as well as for you. Before deciding to invest in foreign exchange you should carefully consider your investment objectives, level of experience, and risk appetite. The possibility exists that you could sustain a loss of some or all of your initial investment and therefore you should not invest money that you cannot afford to lose. You should be aware of all the risks associated with foreign exchange trading, and seek advice from an independent financial advisor if you have any doubts.
Recommended Content
Editors’ Picks
Crypto Today: Bitcoin retakes $95K, Binance lists ChainGPT, Kenya moves to legalize digital assets
The cryptocurrency market snapped its three-day losing streak on Friday, gaining 3% as it reached $3.2 trillion valuation. Bitcoin price struggled to retake the $95,000 support level.
Binance, Uniswap, Bitget traders see $14.8B market cap rise as exchange tokens rebound
Exchange native tokens including Binance Coin, Uniswap, Bitget rallied on Friday as crypto markets flashed early rebound signals. Could this trigger a major breakout phase in the coming days?
Solana Price Forecast: SOL network update signals more downside risks
Solana price established a firm support above $180 on Friday as the crypto market sell-off subsided. Recent market reports suggest Solana's recently proposed network update could trigger further downside risks ahead.
Three reasons why Bitcoin might correct while XRP, Ethereum rally next week
Bitcoin, Ethereum and XRP gained slightly on Friday, even as the three assets erased their value in the past seven days. Experts predict a higher-than-usual volatility in both BTC and ETH next week, with a likelihood of a correction in Bitcoin in Q1 2025.
Bitcoin: Room for a recovery or continuation of the pullback?
Bitcoin’s (BTC) price slightly recovers and trades around $94,700 on Friday after declining nearly 6% earlier this week. US Bitcoin spot Exchange Traded Funds (ETF) data shows signs of mild recovery, with a total net inflow of $462.2 million until Thursday. A 10xResearch report released this week projects Bitcoin’s price action for the upcoming major events in January.
Best Forex Brokers with Low Spreads
VERIFIED Low spreads are crucial for reducing trading costs. Explore top Forex brokers offering competitive spreads and high leverage. Compare options for EUR/USD, GBP/USD, USD/JPY, and Gold.