Algorand price is a Market Makers playground; here's how to avoid getting trapped
- Algorand price is in a declining parallel trend channel
- ALGO and price action suggest a counter-trend move could happen soon.
- Invalidation of the bearish thesis is a close above $0.78

ALGO price is undergoing a very tricky scenario in terms of price direction. The best approach for traders is to wait until an ideal opportunity to present itself.
Algorand price shows mixed signals
Algorand price could continue falling to the $0.63 level, but traders should not expect a clear path to the target. Now that the ALGO price has invalidated the sideways triangle idea mentioned in last week's thesis, market makers seem to have a bearish grip on the ALGO price. However, the path towards lower targets at $0.60 and $0.55 could be a bumpy road with liquidity grabs and fakeouts along the way.
Algorand price currently trades at $0.66, the lowest price established for April to date. The ALGO price action looks more corrective than impulsive as the price has printed a doji candle with significant volume at the lower end of the trend line. The doji is also accompanied by a hidden bullish divergence marked on the Relative Strength Index.
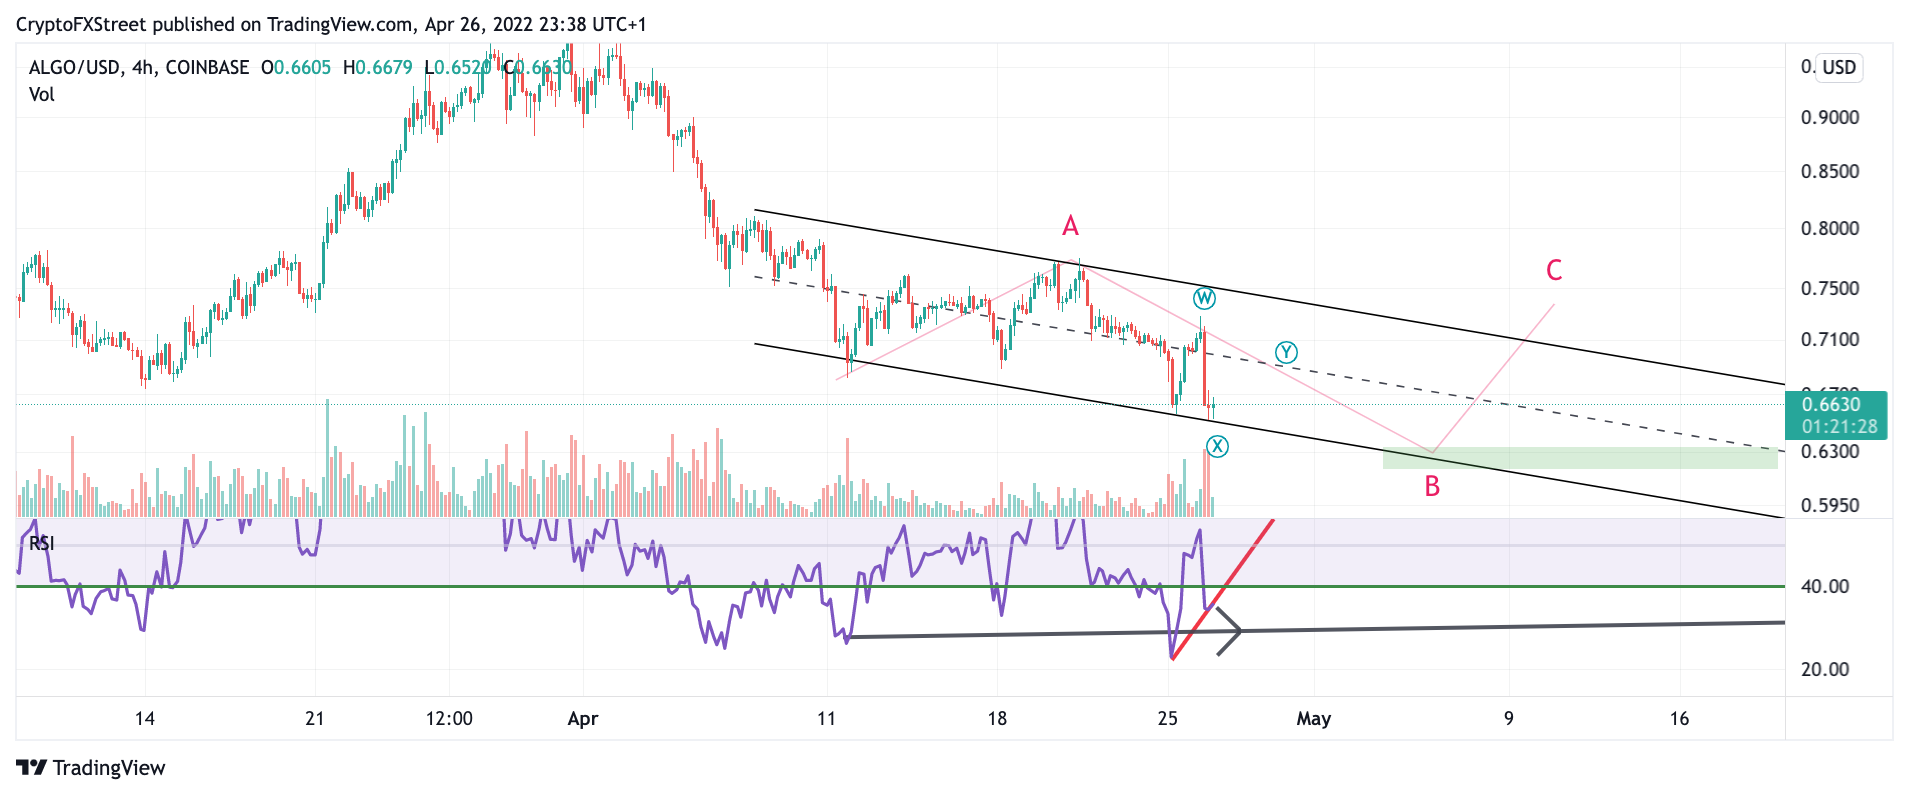
ALGO/USD 4-Hour Chart
There is no confirmation for a bull rally soon, but directional trend changes can frequently occur within the current trend channel. An Invalidation of the downtrend can only occur if the bulls can manage a breach and close above the upper boundary of the trend line at $0.78.
A false breakout can occur, so being the early buyer is considered high risk. A pullback will eventually occur if the bulls can close above $0.78. The second breakout could be a confident entry with the ALGO price targeting $0.87, resulting in a 30% increase from the current ALGO price.
Author

Tony M.
FXStreet Contributor
Tony Montpeirous began investing in cryptocurrencies in 2017. His trading style incorporates Elliot Wave, Auction Market Theory, Fibonacci and price action as the cornerstone of his technical analysis.


