- Aave price hints at a 20% correction as it nears the end of a bearish pattern.
- Transactional data shows non-existent support below the current price level at $395.
- A bullish scenario might come into play if AAVE climbs above $445.
Aave price has been trending higher but could drop soon due to the formation of a bearish pattern.
Aave price eyes a pullback
Aave price has formed three higher highs and three lower lows since February 24. Drawing trendlines along the swing highs and the swing lows results in a rising wedge pattern. This pattern forecasts a 23% downswing, determined by measuring the distance between the pivot points at the widest part of the wedge and adding it to the breakout point at $395.
Therefore, a 4-hour candlestick close below $395 will signal the end of the rising wedge pattern and kickstart a downtrend to $302.
Supporting this bearish thesis for Aave is the recently spawned sell signal by the SuperTrending indicator.
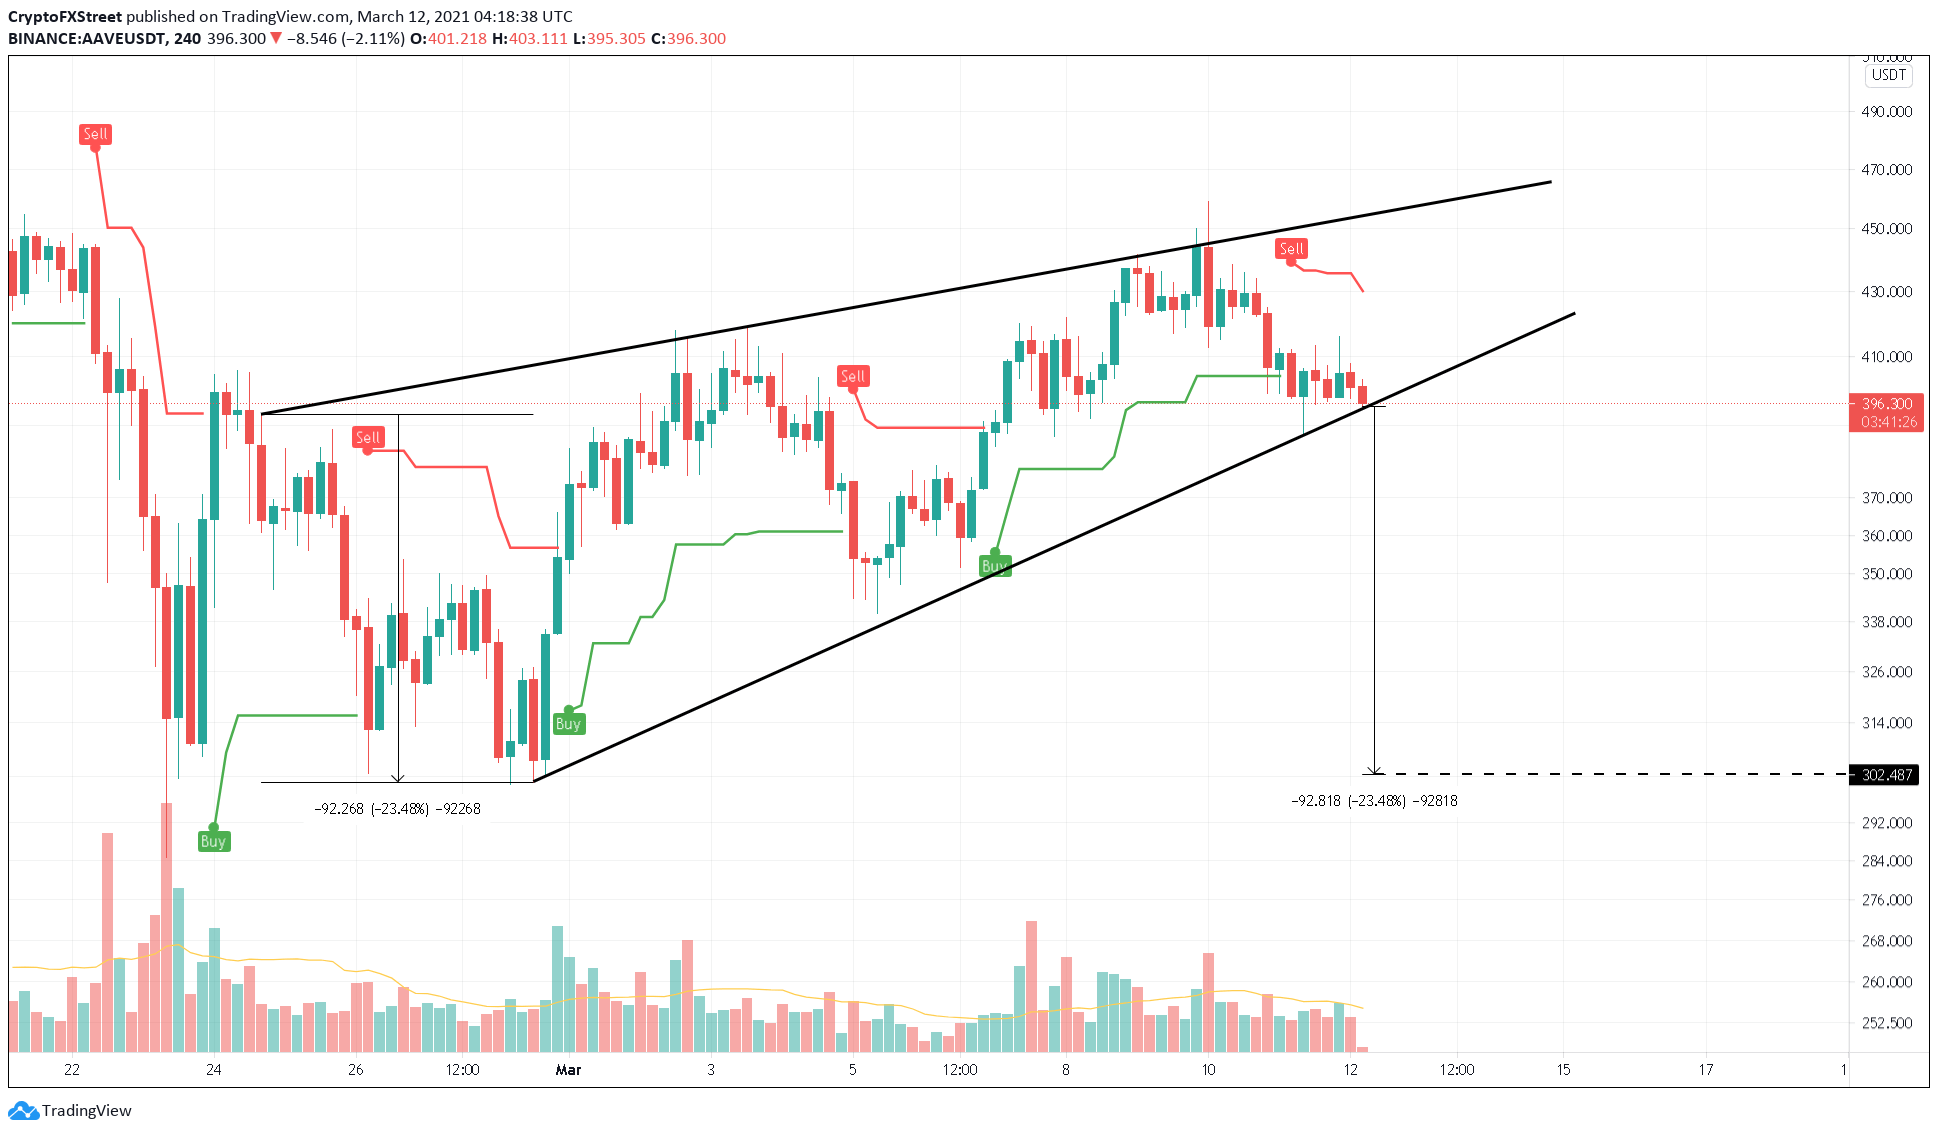
AAVE/USDT 4-hour chart
According to IntoTheBlock’s In/Out of the Money Around Price (IOMAP) model, Aave’s condition looks dire as it shows a massive cluster of underwater investors around the $408 level. Here, roughly 2,600 addresses that previously purchased 3.45 million AAVE are “Out of the Money.” Hence, these market participants might deter any short-term bullish momentum by selling their holdings to breakeven.
However, what’s worrisome is that the DeFi coin shows little to no support present below the current AAVE price. IOMAP cohorts reveal a tiny support level at $379, where 1,600 addresses hold 302,000 AAVE tokens.
Aave IOMAP chart
However, a sudden spike in buying pressure leading to a decisive close above $401 will temporarily remove selling pressure from the underwater investors present at that level. In such a case, AAVE price might surge higher.
A 4-hour candlestick close above $445 will invalidate the bearish outlook as it would create a higher high and signal a resurgence of bullish momentum.
Information on these pages contains forward-looking statements that involve risks and uncertainties. Markets and instruments profiled on this page are for informational purposes only and should not in any way come across as a recommendation to buy or sell in these assets. You should do your own thorough research before making any investment decisions. FXStreet does not in any way guarantee that this information is free from mistakes, errors, or material misstatements. It also does not guarantee that this information is of a timely nature. Investing in Open Markets involves a great deal of risk, including the loss of all or a portion of your investment, as well as emotional distress. All risks, losses and costs associated with investing, including total loss of principal, are your responsibility. The views and opinions expressed in this article are those of the authors and do not necessarily reflect the official policy or position of FXStreet nor its advertisers. The author will not be held responsible for information that is found at the end of links posted on this page.
If not otherwise explicitly mentioned in the body of the article, at the time of writing, the author has no position in any stock mentioned in this article and no business relationship with any company mentioned. The author has not received compensation for writing this article, other than from FXStreet.
FXStreet and the author do not provide personalized recommendations. The author makes no representations as to the accuracy, completeness, or suitability of this information. FXStreet and the author will not be liable for any errors, omissions or any losses, injuries or damages arising from this information and its display or use. Errors and omissions excepted.
The author and FXStreet are not registered investment advisors and nothing in this article is intended to be investment advice.
Recommended Content
Editors’ Picks
Ripple's move above this key level could trigger nearly 50% rally for XRP
Ripple has overcome a critical resistance level and flipped into a support floor on the weekly time frame. This development happened while XRP tightly consolidated for roughly 250 days. Investors can expect XRP to kickstart a massive rally.
Optimism price outlook with nearly $90 million worth of OP tokens flooding markets on Friday
Optimism volatility has shrunk in the ours leading to the network’s cliff unlock. It joins the likes of dYdX and Sui, which have similar events on their calendars. As token unlocks are often considered bearish catalysts, investors should brace for a reaction after the event.
Top 3 Price Prediction Bitcoin, Ethereum, Ripple: Retail watches from the sidelines with a bias for shorts
Bitcoin could clear $73,777 peak as BTC bulls resurface. Ethereum might fall 10% before next leg up as ETH RSI teases with sell signal. XRP could lose $0.6000 threshold as Ripple bulls fail to show up.
Jito price could hit $6 as JTO coils up inside this bullish pattern
Jito price action shows a potential cup and handle formation. Based on theoretical measurement rules, a successful breakout could yield a 56% rally to $6.0. A breakdown of the $3.86 support level would create a lower low for JTO and invalidate the bullish thesis.
Bitcoin: BTC may have recovered, but is it out of the woods?
Bitcoin’s (BTC) upward momentum has shown a significant decline for the past two weeks or so. This development led to a bearish signal on the weekly and an uncertain outlook on the monthly.