A simple explanation for Bitcoin's plunge

Bitcoin mania hit an air pocket on Sunday with a so-far $11,500 plunge from last week's record-high $64,858. Groping for an explanation, Bloomberg and other mainstream sources attributed the drop to speculation that the U.S. Treasury might crack down on digital-money laundering. Yeah, sure. This tired story has been marking time for a decade, ever since the days when only a few hardcore gamers knew about blockchain money. Now it is being reheated and served up as a convenient explanation for bitcoin's nuttiness, much as stories about "tariff fears" and "vaccine hopes"' were trotted out each and every time mass psychosis seized traders.
Crypto fans had better get used to the crackdown story. Recall that it took almost two years for the news media's tariff-war allegory to die a natural death. This occurred when the "war" itself became too convoluted for the supposed experts to explain. Eventually, and mercifully, they came to realize that they were only embarrassing themselves when they tried. Now financial writers have trained their wellspring of ignorance on the latest tabloid story involving markets -- the epic mania in cryptocurrency. While this may be a welcome respite from sensationalist blather about how Reddit kids were crushing the hedge funds, it hardly serves to explain bitcoin's rabid swings. So let me try, even though the simple explanation is voodoo stuff that will never surface on Bloomberg or Jim Cramer's vaudeville show.
'Hidden Pivots' Rule!
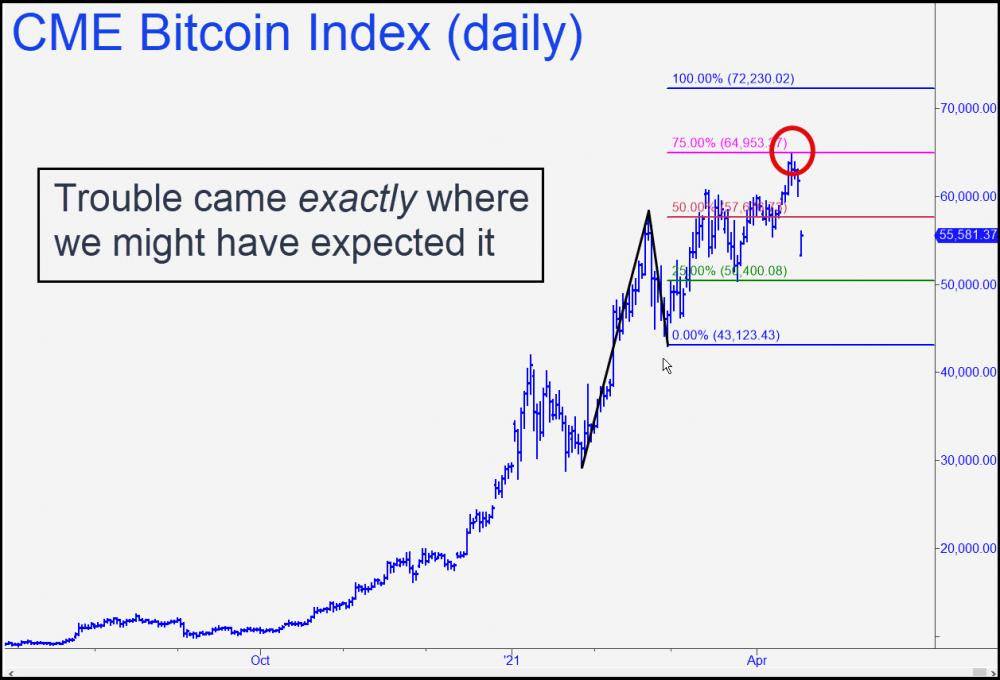
First understand that there is no rational explanation for the day-to-day histrionics of deranged markets. The overarching mania is not hard to understand. It exists, and intensifies until climax, because speculators increasingly become convinced they can get rich quickly and with little actual work. However, short-term whoops, dives and spasms can be explained and even predicted only by using charts. Thus can we assume that bitcoin's big drop on Sunday was unrelated to any particular news. In fact, it began, unsurprisingly, from within 0.1% of a clear Hidden Pivot resistance at 64,953 shown in the chart. As for the 'crackdown' explanation, we can be certain it will vanish the moment bitcoin's bullish rampage resumes. Rinse and repeat.
Now for the technical picture. If you have trouble with chart voodoo, stop by the Rick's Picks chat room and ask about it. Subscribers will tell you that, for all the wild price swings, bitcoin has yet to generate an unprofitable 'buy' signal based on a proprietary trick we use called a 'mechanical' set-up. Moreover, it would do so again if the current plunge were to hit the green line, a Hidden Pivot benchmark at exactly 50,400. The trade would be predicated on an eventual recovery to $72,230. A word of caution: This trade is not for amateurs or the faint-hearted, since the initial risk, using a stop-loss just beneath the pattern's point 'C' low at $43,123, would exceed $30,000 for four round lots. We have ways to cut that down to $3000 or less theoretical, but you'll need to immerse yourself in the chat room for a couple of weeks to discover how.
Author

Rick Ackerman
Rick’s Picks
Barron’s once labeled Rick Ackerman an “intrepid trader” in a headline that alluded to his key role in solving a notorious pill-tampering case.


