A Muted Start – Finding Crypto Bulls (and it's difficult)
A Muted Start
The broader crypto market sentiment remains gloomy as we wrap up September, and that sentiment is likely to carry on into early October. The prices of bitcoin remained at around 8000 levels as we kick off the last trading day of September. In our recent publication <Greedy When Others Are Fearful?>, we show that bitcoin's real support could be in the 7,500 to 8,000 area.
The muted start of Bakkt's physically-settled bitcoin futures somewhat disappointed the markets. Data shows that the first-week trade volume of Bakkt was around 5.8 million USD and managed to get traders interested in 5 bitcoin worth of its physically delivered daily futures, but it contrasts when comparing it to the first-week performance of CME futures, which has 460 million USD of volume. Despite the weaker than expected launch, some analysts still believe Bakkt could bring bitcoin trading one step closer to the mainstream investment markets.
Meanwhile, major altcoins were under pressure again, but some have managed to rebound from recent lows, so sentiment remained mixed for now. One of the focuses in the markets is Ethereum, which failed to stay above the key 200 levels after the bitcoin selloff. However, ETH's sentiment could take a major shift with the upcoming ETH network upgrade. The so-called Istanbul upgrade is reportedly scheduled to take place in the coming months, which includes a change to the Ethereum protocol, adding new rules to improve the system from the Ethereum Improvement Proposals (EIPs). Although upgrades are generally bullish for crypto and this could be a major factor to drive ETH in the medium-term, however, some cases show a different picture.
Staying in blockchain, we see bitcoin's hash rate has rebounded to a near all-time high after plunging 30% last week, while we will keep a close eye on what's happening in the blockchain, you can read more about the dynamics of bitcoin has rate and prices here.
Price Analysis - BTCUSDT
-
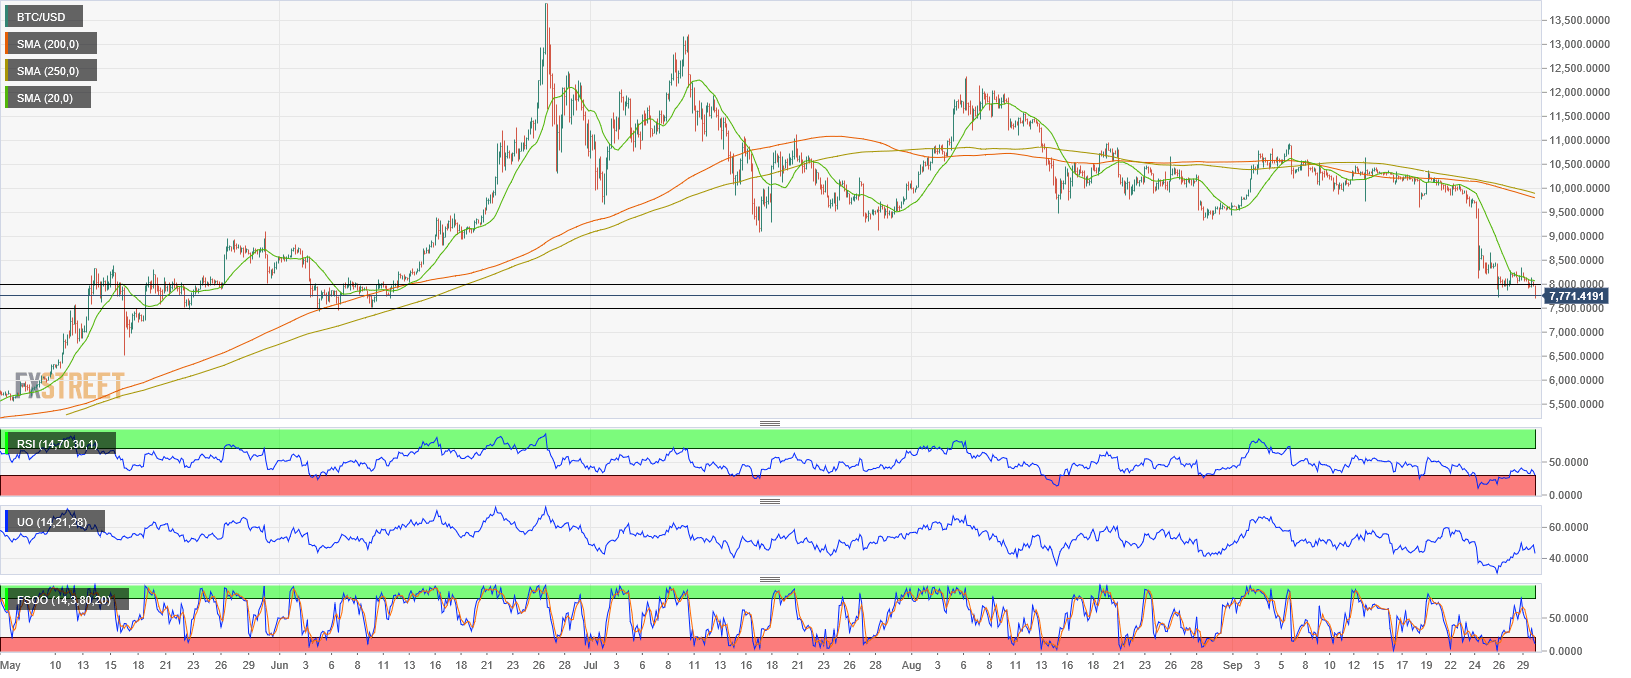
We maintain our view and believe that BTC's support would be in the 7500 to 8000 area, which is the two major levels back in May and June (figure 1A).
-
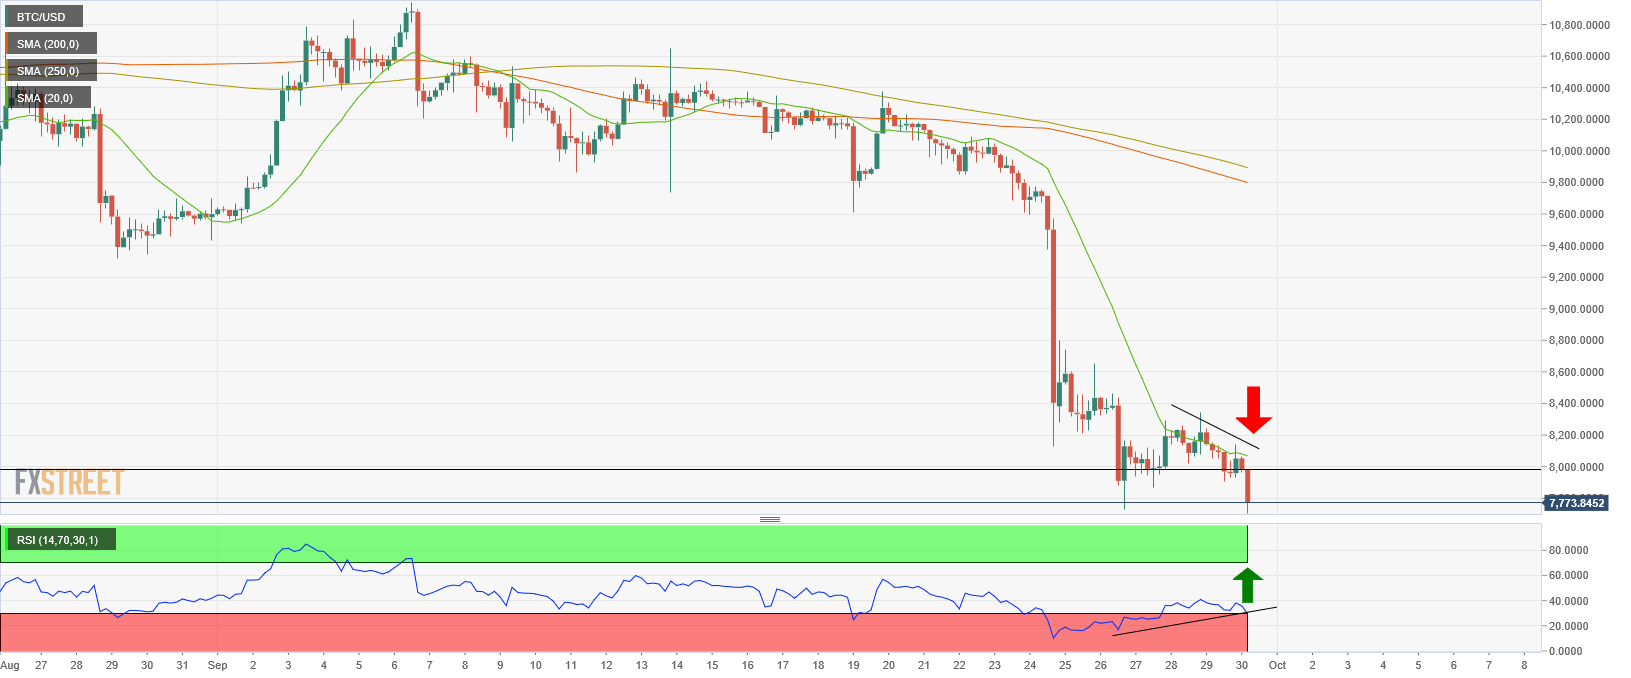
A short-term rebound could be insight, as the RSI has been developing some higher lows and seems to form a bullish divergence (figure 1B).
-
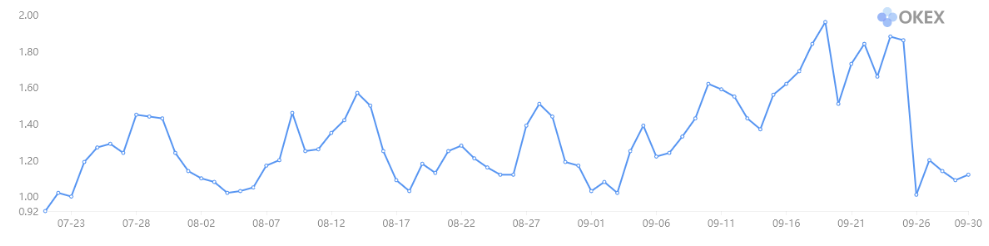
OKEx's BTC Long/Short Ratio (figure 2) also indicates that short traders may have to hold back a little bit after the selloff last week, while open interest has been gradually picking up (figure 3).
Figure 1A: BTCUSDT 4-Hour Chart
(Source: FX Street)
Figure 1B: BTCUSDT 4-Hour Chart
(Source: FX Street)
Figure 2: OKEx's BTC Long/Short Ratio
(Source: OKEx)
Figure 3: OKEX's BTC Futures Open Interest and Trading Volume
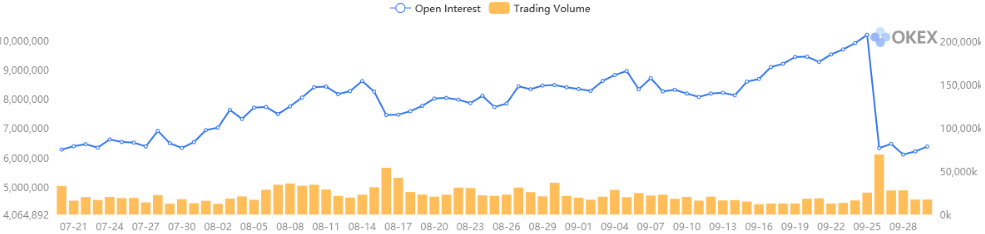
(Source: OKEx)
ETHUSDT
-
The pair has recovered slightly better than BTCUSD, as it produced some higher lowers on the daily chart (figure 4).
-
The -DI remains at a high level, indicating that the downward pressure is persisting but seems gradually slowing.
-
OKEx's ETH Long/Short Ratio suggests that ETH traders may have been taking a wait-and-see approach before making any major move.
Figure 4: ETHUSD Daily Chart
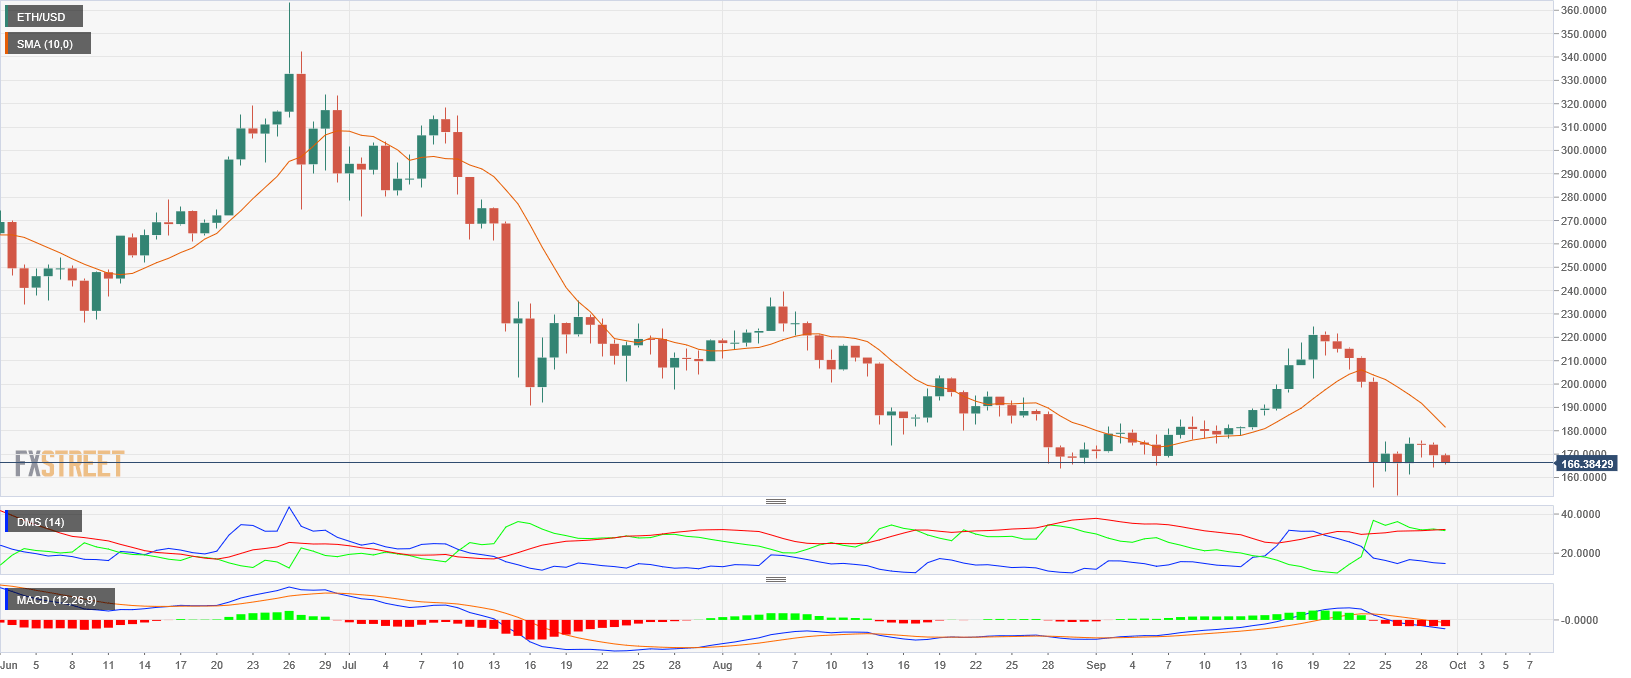
(Source: FX Street)
Figure 5: OKEx's ETH Long/Short Ratio (Source: OKEx)
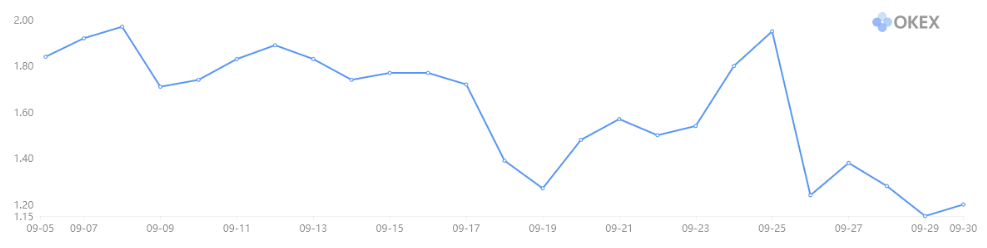
(Source: OKEx)
ALGOUSDT
-
ALGO is one of the gainers in the altcoin space on Monday Asia trading, it traded 15% higher against USDT.
-
ALGOUSDT is one of the pairs that able to recover and stay above the 10 and 20-SMA on a 4- hour chart.
-
The MACD was set to go into the bullish zone but yet to produce a bullish crossover.
-
However, the pair seems to have formed an ascending triangle pattern, and it's considered a bullish sign.
Figure 6: ALGOUSDT 4-Hour Chart
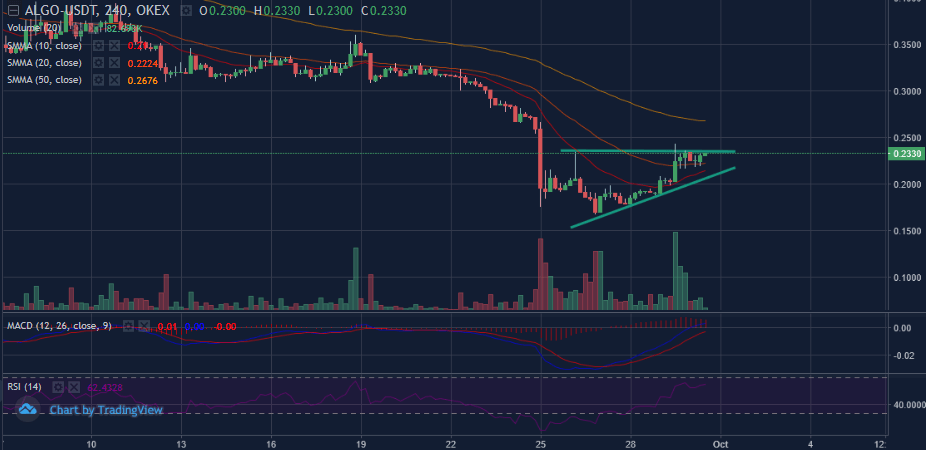
(Source: OKEx, Tradingview)
HBARUSDT
-
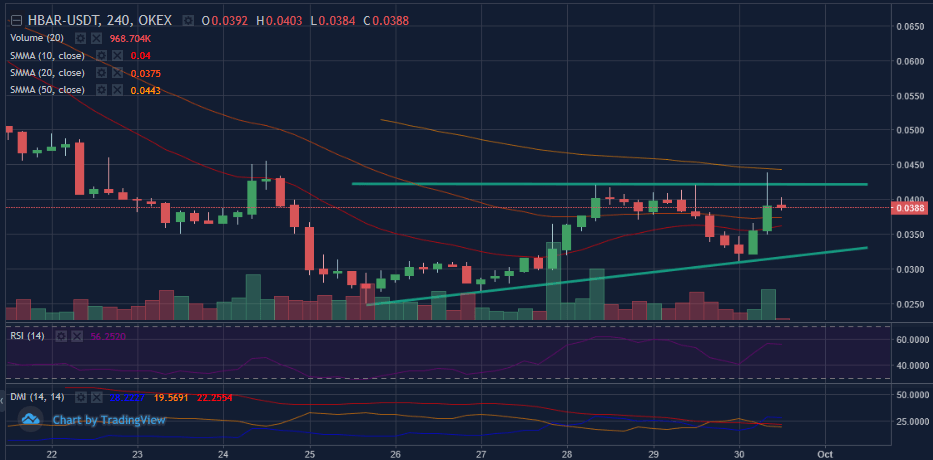
HBARUSDT is another interesting pair to look at, like ALGO, HBARUSDT has also regained the 10 and 20-SMA on a 4-hour chart, and almost back to pre-September selloff levels.
-
The pair could have possibly formed an ascending triangle pattern if the uptrend continues.
-
However, the RSI suggests that a bullish breakout seems unlikely in the near term.
Figure: 7: HBARUSDT 4-Hour Chart
(Source: OKEx, Tradingview)
Author

Cyrus Ip
OKEx
Cyrus Ip has the privilege to work with OKEx as a Research Analyst, where he found some of the brightest talents in the crypto space.


