1inch Price Forecast: 1INCH set for double-digit gains
- 1inch price is nearing a key resistance zone, with a break above it suggesting a potential rally ahead.
- On-chain data shows a surge in daily transactions and active addresses, indicating growing network activity.
- The technical outlook suggests fading bearish momentum with bulls preparing to take control.

1inch (1INCH) price is showing early signs of strength, trading around $0.243 at the time of writing on Wednesday, as it approaches a key resistance zone. A breakout above this barrier could extend double-digit gains ahead. On-chain data further support the bullish view, as daily transactions and active addresses surge, indicating growing network activity. Adding to this optimism, the technical momentum suggests that bulls may soon regain control, opening the door for a potential rally.
1inch’s on-chain data show early signs of strength
Santiment’s Daily Active Addresses index, which tracks network activity over time, paints a bullish picture for 1INCH. A rise in this metric indicates increased blockchain usage, while a decline in addresses suggests lower demand for the network.
In 1INCH’s case, Daily Active Addresses rose to 551 on Monday from 267 on Saturday, the highest level since mid-July, signaling growing network activity, which bodes well for the 1inch price.
 [10-1756878773879-1756878773882.25.21, 03 Sep, 2025].png)
1inch daily active addresses chart. Source: Santiment
Apart from this, daily transaction volume surged to 54.28 million on Monday, marking its highest level since mid-July and suggesting renewed network activity and growing user participation.
 [10-1756878795385-1756878795387.26.14, 03 Sep, 2025].png)
1inch daily transaction volume chart. Source: Santiment
Moreover, on Monday, 1inch announced a partnership with Barter, bringing a seasoned swap resolver to the DeFi space. This partnership enables users to execute intent-based swaps, delivering more efficient and cost-effective trades.

1inch Price Forecast: Technical indicators show fading bearish momentum
1inch price found support around its daily level at $0.234 on Monday and recovered 3.21% the next day, nearing a key resistance zone between $0.247 and $0.254, where the 50-day, 100-day and 200-day Exponential Moving Averages (EMAs) converge with a descending trendline of a symmetrical triangle pattern on the daily chart. A breakout above this zone favours bulls, and at the time of writing on Wednesday, 1INCH hovers around $0.243.
If 1inch closes above the 50-day EMA level at $0.254 on a daily basis, it could extend the rally toward the 50% Fibonacci retracement, drawn from the June 22 low of $0.157 to the July high of $0.391, at $0.274. A successful close above this level could extend gains toward the next resistance at $0.302 (61.8% Fibonacci retracement).
The Relative Strength Index (RSI) on the daily chart reads 45, approaching its neutral level of 50, indicating a fading of bearish momentum. The Moving Average Convergence Divergence (MACD) lines are also nearing each other with decreasing red histogram bars, suggesting a bullish crossover could happen in the coming sessions.
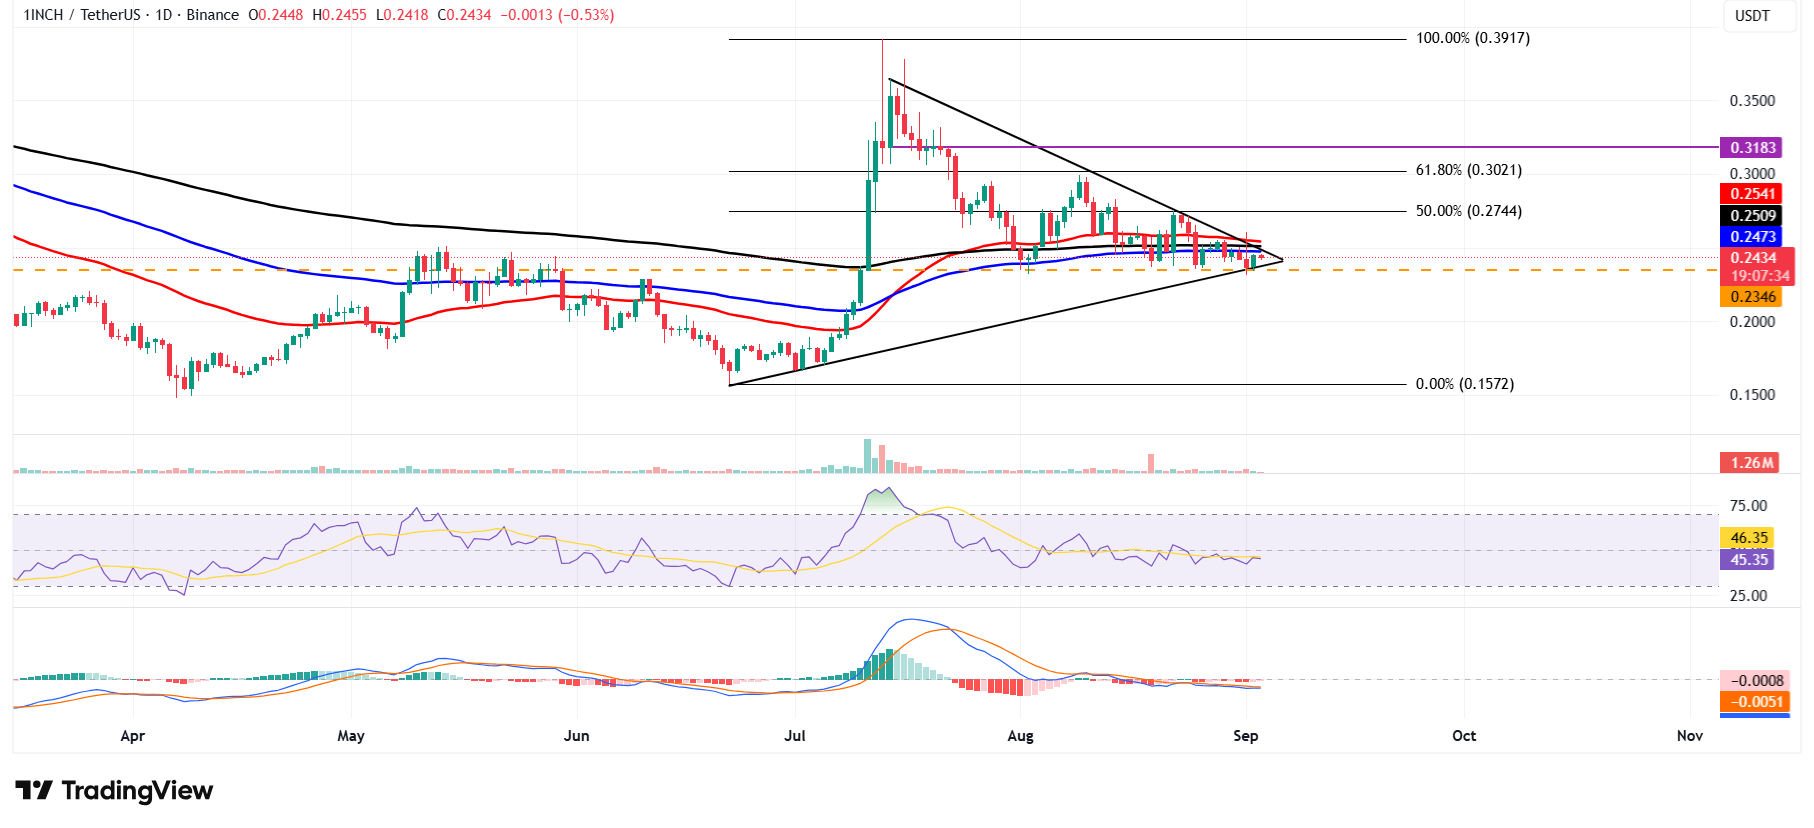
1INCH/USDT daily chart
However, if 1INCH faces a correction, it could extend the decline toward its daily support at $0.234.
Author

Manish Chhetri
FXStreet
Manish Chhetri is a crypto specialist with over four years of experience in the cryptocurrency industry.


