1inch Price Forecast: 1INCH launches native cross-chain swaps between Solana and EVM chains
- 1inch price recovers slightly on Wednesday after closing below the 200-day EMA at $0.24, down more than 5% so far this week.
- Solana integrated with 12+ EVM networks for cross-chain swaps via 1inch.
- The technical indicators show weakening momentum, hinting at further dips.

1inch (1INCH) price recovers slightly, trading around $0.246 at the time of writing on Wednesday, after closing below its key support level and falling more than 5% so far this week. The downturn comes even as the protocol announces the launch of cross-chain swaps between Solana (SOL) and more than 12 Ethereum Virtual Machine (EVM) networks. Despite this bullish development, technical indicators show weakening momentum, suggesting 1INCH could face additional downside in the upcoming days.
1inch launches Solana cross-chain swaps
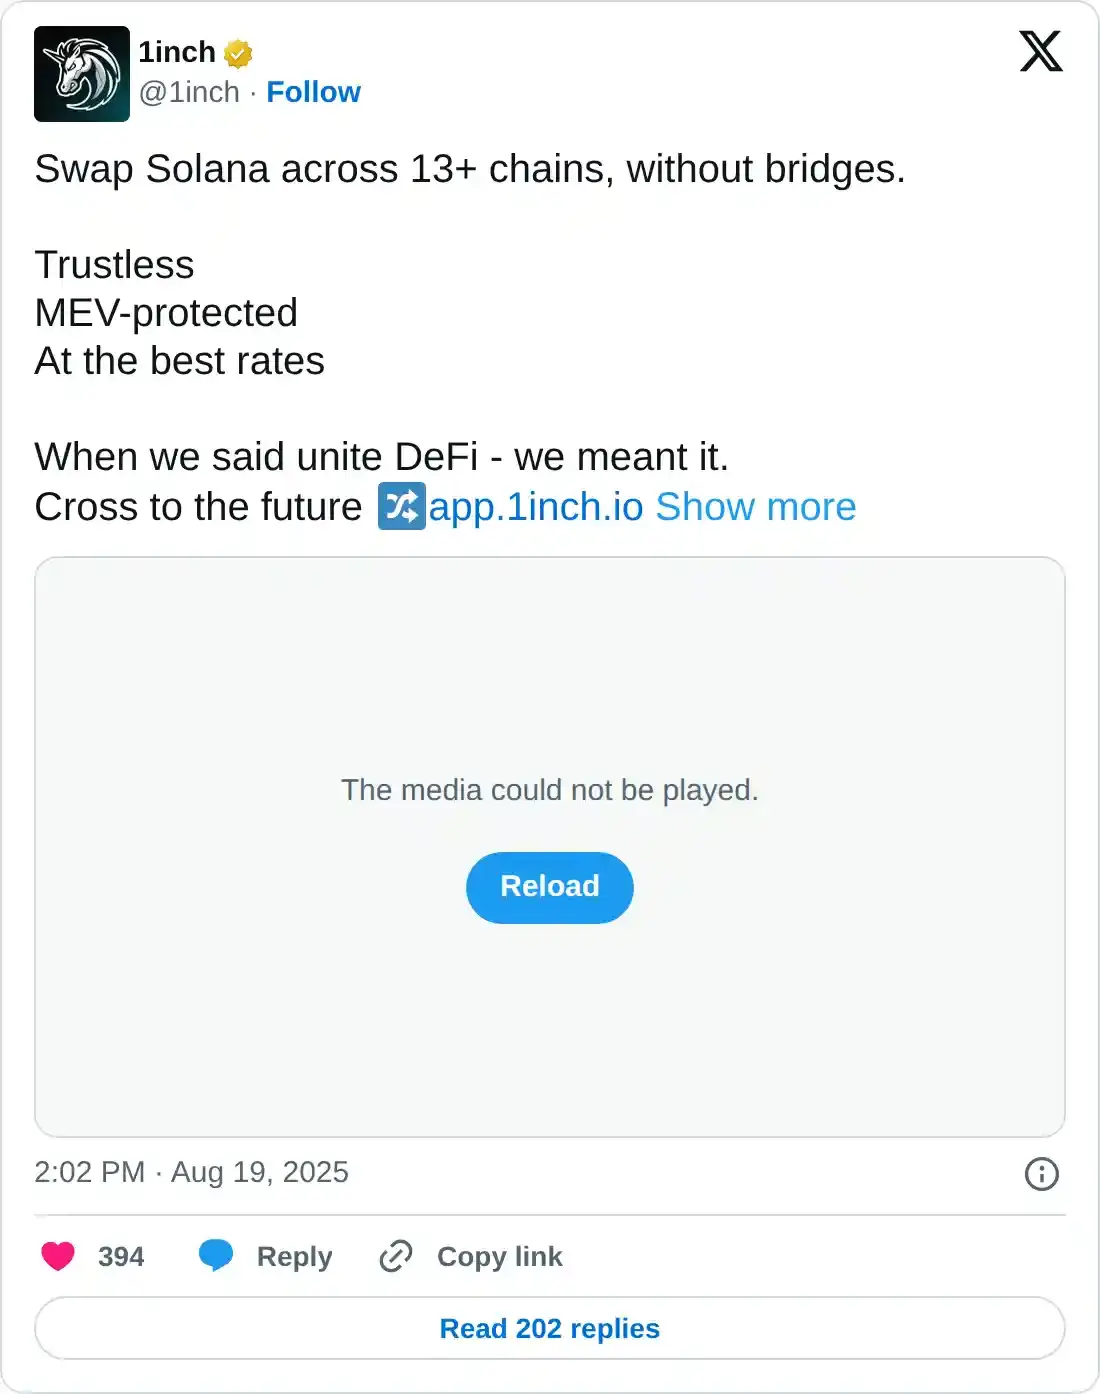
1inch announced on Tuesday that traders and investors can swap assets directly between Solana and EVM networks, without using bridges or messaging protocols via the 1inch network.
This move merges two major blockchain ecosystems - Ethereum (ETH) and Solana - into one, allowing users to swap without worrying about which network they’re using.
“1inch’s cross-chain Solana functionality also delivers a significant boost to the entire Solana ecosystem, ending the chain’s isolation and transforming it into a full-fledged DeFi hub, open to new liquidity and users,” said 1inch on its blog post.
This integration acts as a bullish development for 1inch in the long term, alongside both SOL and ETH, as it opens more liquidity and boosts its wider adoption.
1inch Price Forecast: 1INCH closes below 200-day EMA
1inch price faced rejection from its 61.80% Fibonacci retracement level at $0.30 on August 10 and declined 18% in the next nine days, closing below 200-day Exponential Moving Average (EMA) at $0.246 on Tuesday. At the time of writing on Wednesday, it recovers slightly, approaching the 200-day EMA.
If the 200-day EMA holds as resistance, 1inch could extend the decline toward its August 2 low of $0.232.
The Relative Strength Index (RSI) reads 43 below its neutral level of 50, indicating strong bearish momentum. The Moving Average Convergence Divergence (MACD) also showed a bearish crossover last week and rising red histogram bars, suggesting the continuation of the downward trend.
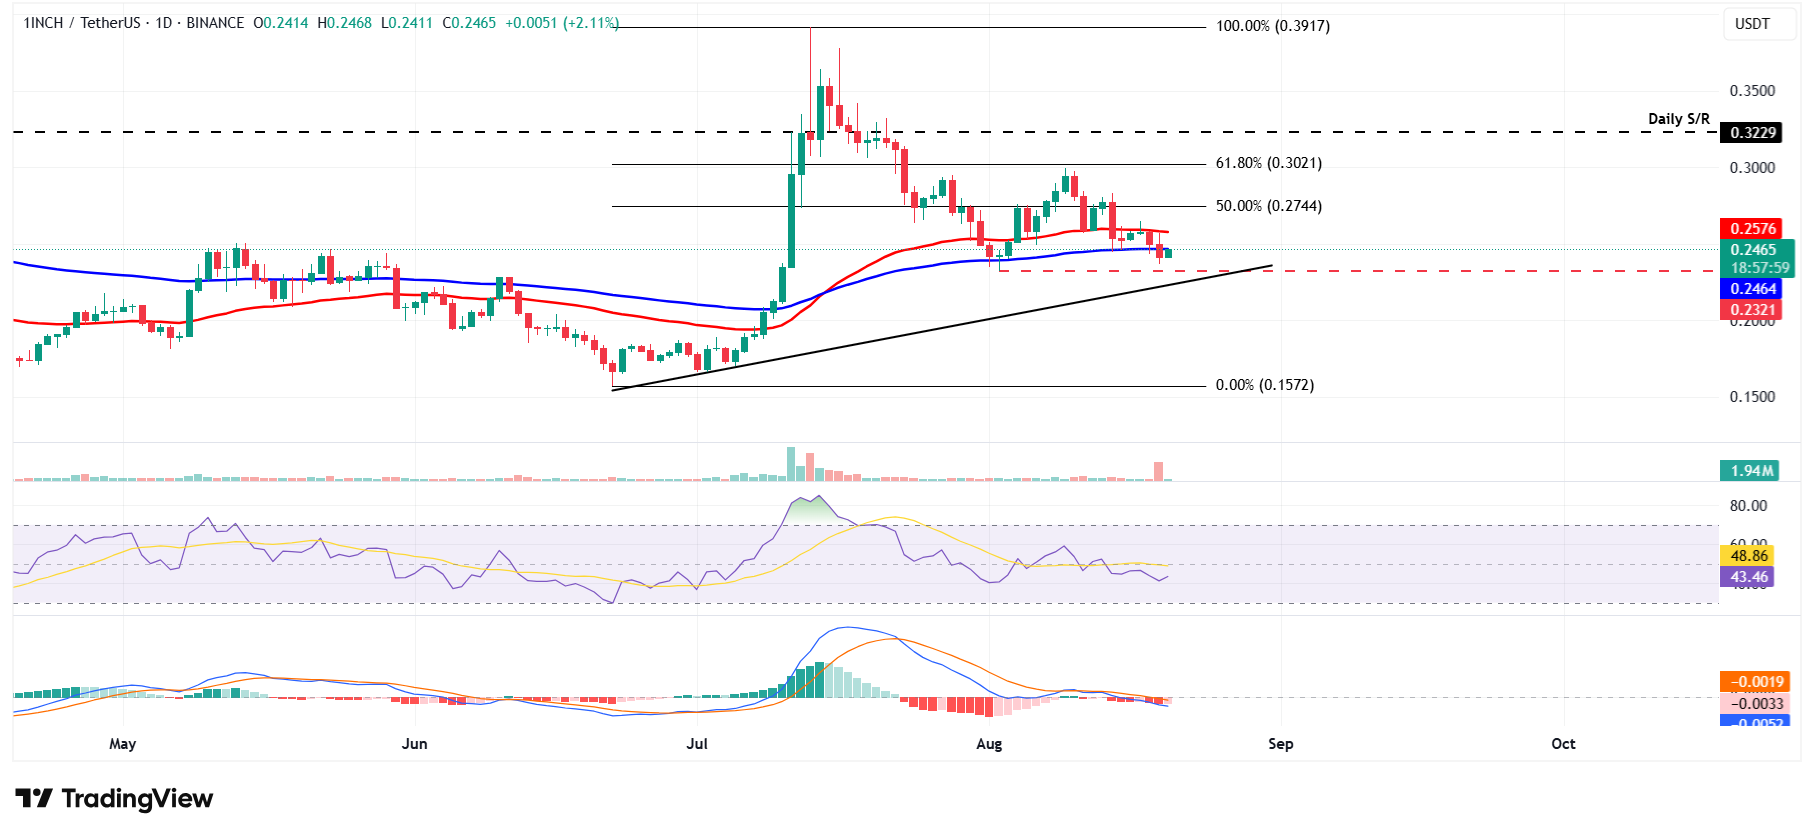
1INCH/USDT daily chart
However, if 1INCH recovers, it could extend the recovery toward its 50-day EMA at $0.257.
Author

Manish Chhetri
FXStreet
Manish Chhetri is a crypto specialist with over four years of experience in the cryptocurrency industry.