Top 3 Price Prediction: Bitcoin, Ethereum, Ripple – BTC, ETH and XRP key supports break as correction deepens
- Bitcoin price falls below the ascending trendline, signaling a shift from a bullish to bearish market structure.
- Ethereum slips below its support at $4,232, with bears eyeing levels below $4,000.
- Ripple’s XRP closes below its 50-day EMA at $2.93, hinting at further correction ahead.

Bitcoin (BTC), Ethereum (ETH), and Ripple (XRP) all closed below key support zones as the correction deepens this week. BTC has fallen under its ascending trendline, and ETH slipped below the critical level with eyes on levels below $4,000. At the same time, XRP closed under its 50-day Exponential Moving Average (EMA) at $2.93, with all these top 3 currencies suggesting further downside pressure ahead.
Bitcoin breaks below the ascending trendline, changes market structure
Bitcoin price extended the decline, closing below $116,300 as the week started, and on Tuesday, it closed below an ascending trendline drawn by connecting multiple lows since early April. During the same period, BTC also closed below the 50-day EMA at $114,903. At the time of writing on Wednesday, it recovers slightly at around $113,400.
If BTC continues its pullback, it could extend losses toward its next support level at $111,980.
The Relative Strength Index (RSI) reads 41 on the daily chart, below its neutral level of 50, indicating bearish momentum. The Moving Average Convergence Divergence (MACD) showed a bearish crossover last week, suggesting a downward trend.
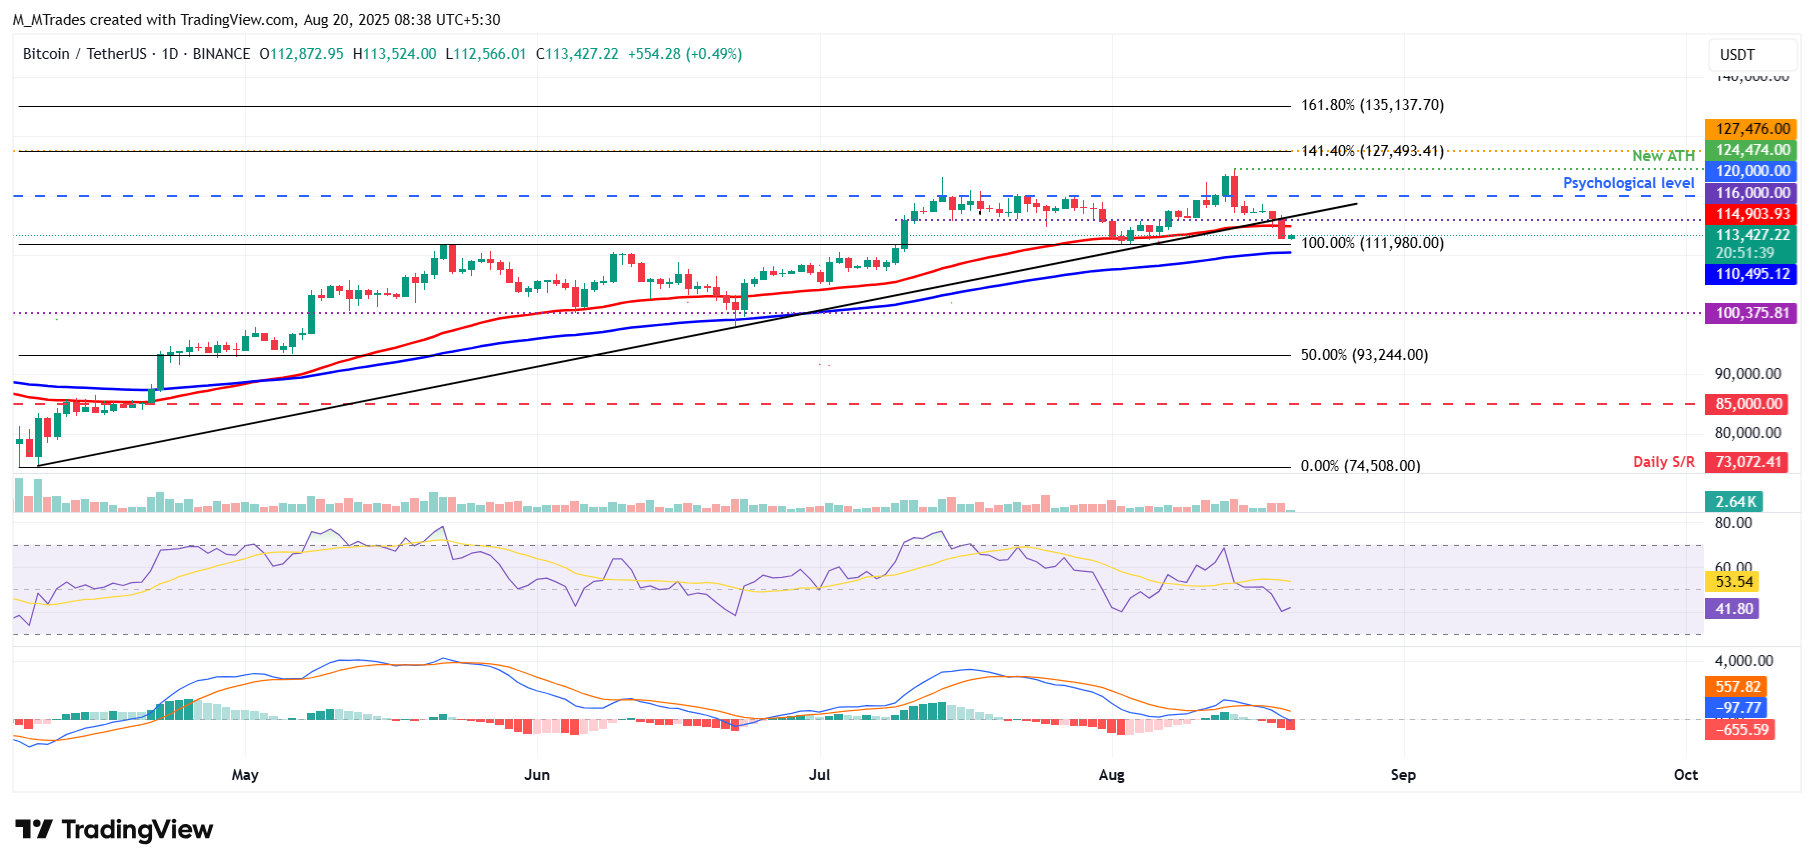
BTC/USDT daily chart
However, if BTC recovers, it could extend the recovery toward its daily level at $116,000.
Ethereum momentum indicators show weakness
Ethereum price reached a new yearly high of $4,788 last week on Thursday, but failed to continue its upward trend and declined nearly 14% in the next five days until Tuesday. At the time of writing on Wednesday, it trades at around $4,132.
If the daily resistance at $4,232 holds as resistance, it could extend the decline toward its next key support at $3,946.
The RSI on the daily chart reads 53, retreating from overbought territory last week and pointing downward, indicating fading bullish momentum. The MACD showed a bearish crossover on Tuesday, further supporting the bearish thesis.
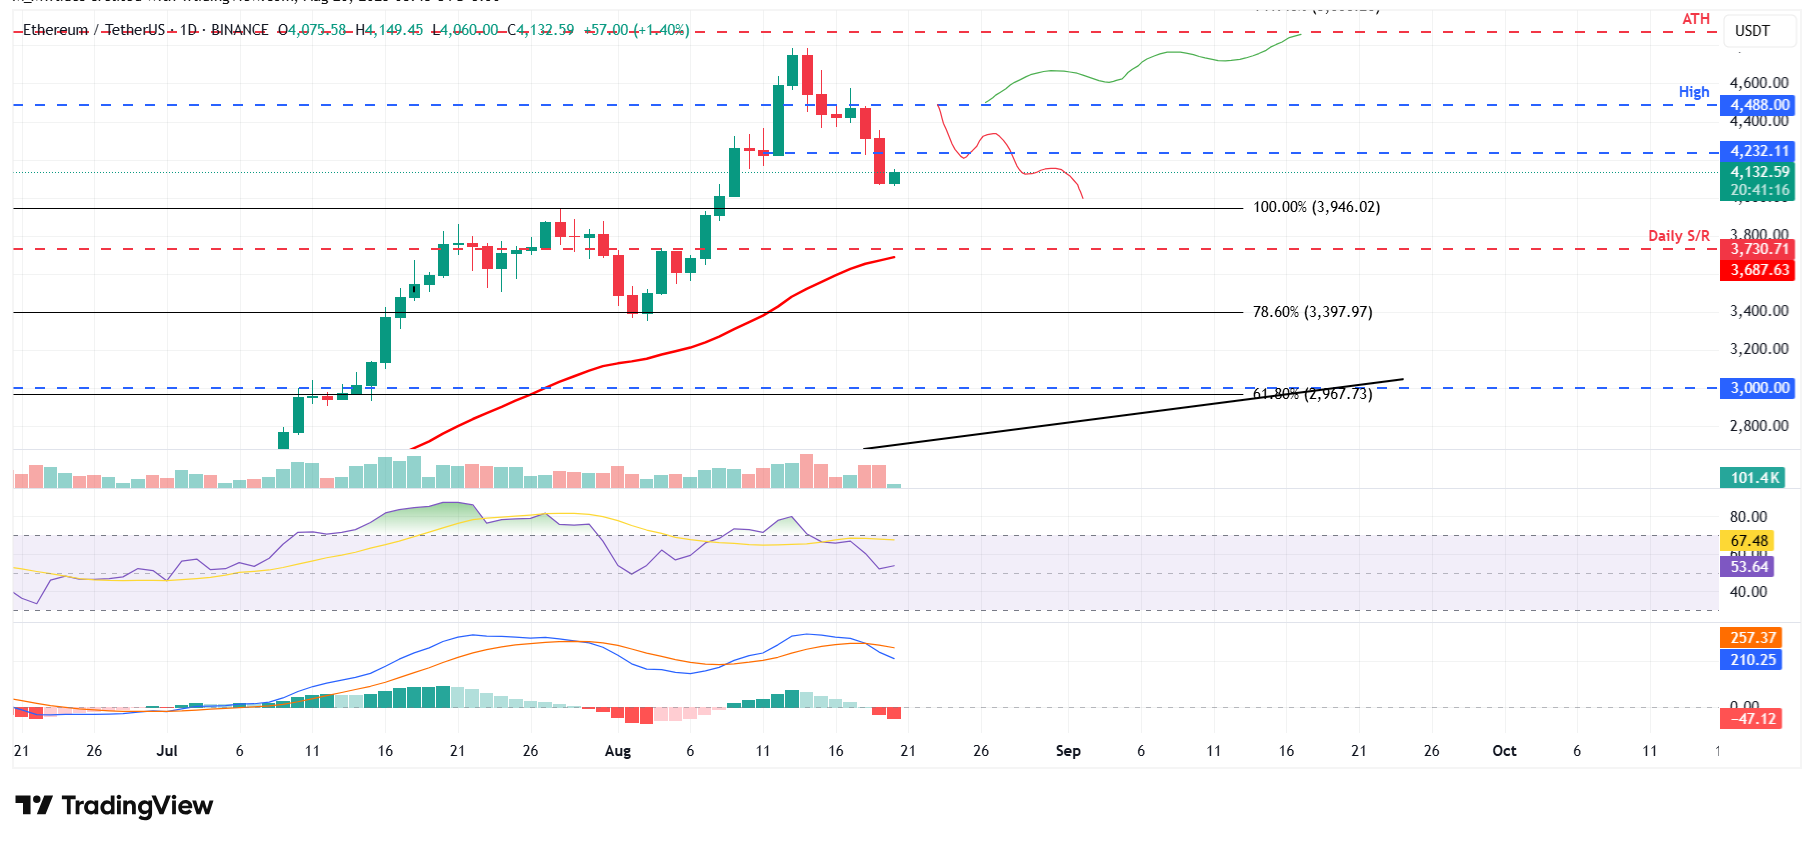
ETH/USDT daily chart
On the other hand, if ETH recovers and closes above the daily resistance at $4,232, it could extend the rally toward its daily resistance at $4,488.
XRP slips below key level, signaling further correction
Ripple’s XRP faced rejection around the daily level of $3.40 on August 14 and declined over 12% in the next five days, closing below the 50-day EMA at $2.93 on Tuesday. At the time of writing on Wednesday, it hovers at around $2.88.
If XRP continues its correction, it could extend the decline toward its next support level at $2.72.
Like BTC, XRP’s momentum indicators, RSI and MACD, also support the bearish thesis.
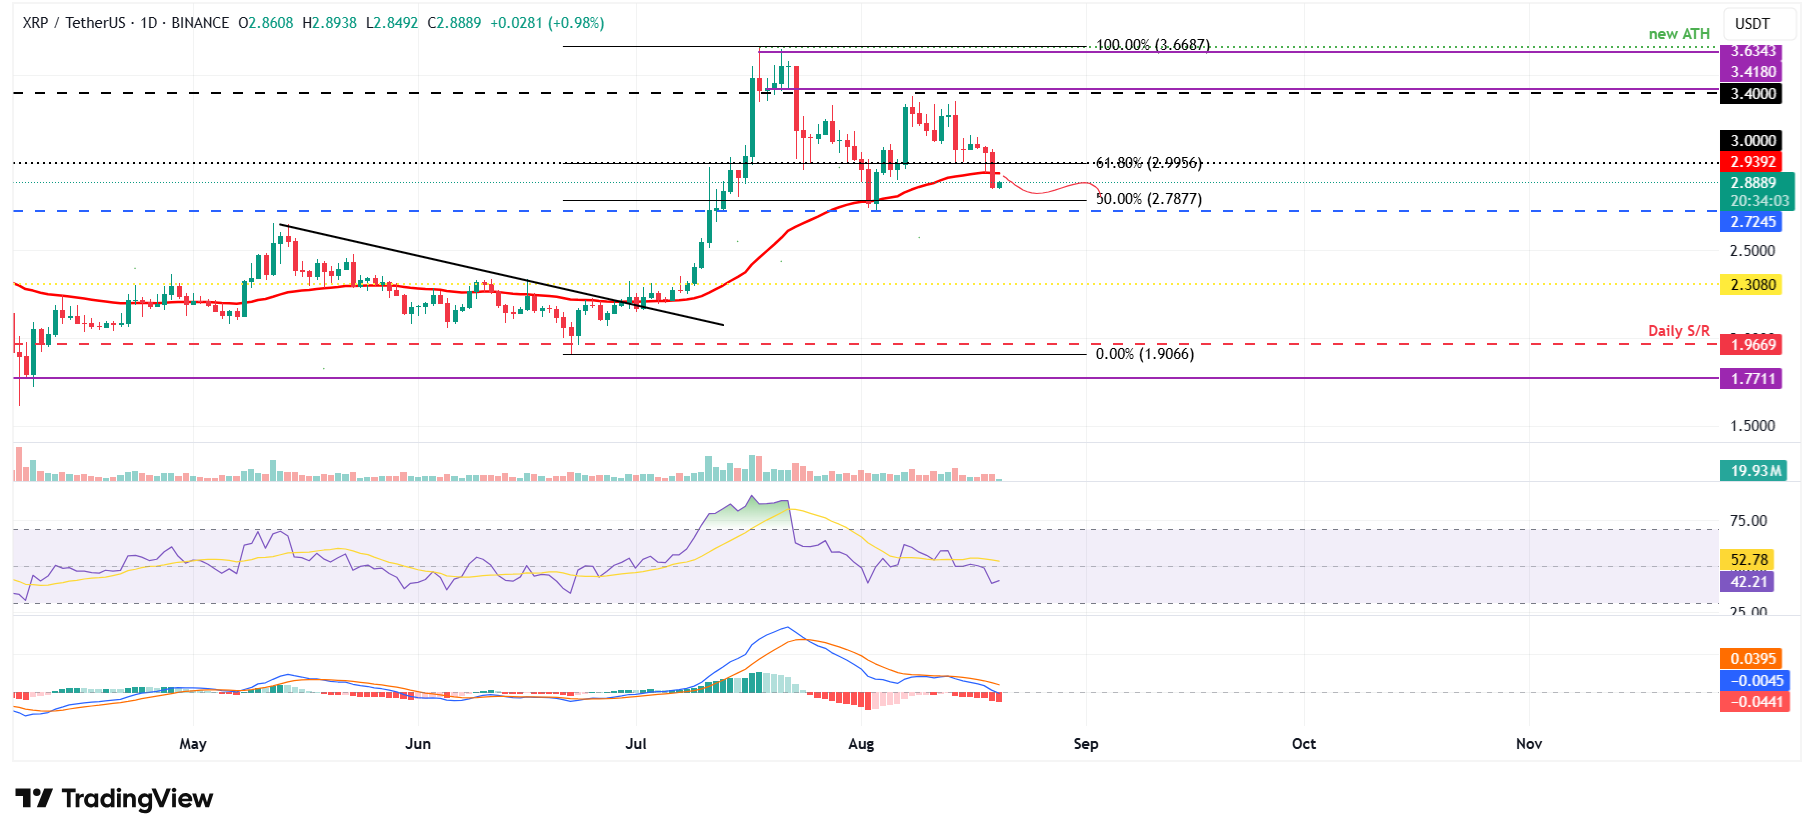
XRP/USDT daily chart
Conversely, if XRP recovers, it could extend the recovery toward its daily resistance at $2.99.
(This story was corrected on August 19 at 05:00 GMT to say Ethereum's could extend the rally toward its daily resistance at $4,488 not record high of $4,868).
Bitcoin, altcoins, stablecoins FAQs
Bitcoin is the largest cryptocurrency by market capitalization, a virtual currency designed to serve as money. This form of payment cannot be controlled by any one person, group, or entity, which eliminates the need for third-party participation during financial transactions.
Altcoins are any cryptocurrency apart from Bitcoin, but some also regard Ethereum as a non-altcoin because it is from these two cryptocurrencies that forking happens. If this is true, then Litecoin is the first altcoin, forked from the Bitcoin protocol and, therefore, an “improved” version of it.
Stablecoins are cryptocurrencies designed to have a stable price, with their value backed by a reserve of the asset it represents. To achieve this, the value of any one stablecoin is pegged to a commodity or financial instrument, such as the US Dollar (USD), with its supply regulated by an algorithm or demand. The main goal of stablecoins is to provide an on/off-ramp for investors willing to trade and invest in cryptocurrencies. Stablecoins also allow investors to store value since cryptocurrencies, in general, are subject to volatility.
Bitcoin dominance is the ratio of Bitcoin's market capitalization to the total market capitalization of all cryptocurrencies combined. It provides a clear picture of Bitcoin’s interest among investors. A high BTC dominance typically happens before and during a bull run, in which investors resort to investing in relatively stable and high market capitalization cryptocurrency like Bitcoin. A drop in BTC dominance usually means that investors are moving their capital and/or profits to altcoins in a quest for higher returns, which usually triggers an explosion of altcoin rallies.
Author

Manish Chhetri
FXStreet
Manish Chhetri is a crypto specialist with over four years of experience in the cryptocurrency industry.


