Zweig indicator

S2N spotlight
My X feed was buzzing today with analysts outdoing themselves calling Zweig Thrust Signals. I don’t know why; call me immature, but every time I think of the Zweig Thrust Indicator, I think of this scene in the movie Perfect with Jamie Lee Curtis and John Travolta.
So what is the Zweig Indicator? I am going to hand over to my assistant to explain this.
The Zweig Breadth Thrust is a market breadth indicator developed by legendary investor and economist Dr. Martin Zweig. It’s designed to identify the start of a new bull market by detecting a sudden surge in the number of advancing stocks relative to declining ones.
Rather than waiting for lagging confirmation like price breakouts, the Zweig Breadth Thrust aims to spot moments when momentum shifts dramatically under the surface, signalling institutional accumulation and improving sentiment.
Zweig originally used NYSE advance-decline data, but modern variants compute the thrust within specific indexes like the S&P 500 or Nasdaq. You can access excellent data from Norgatedata at a reasonable price.
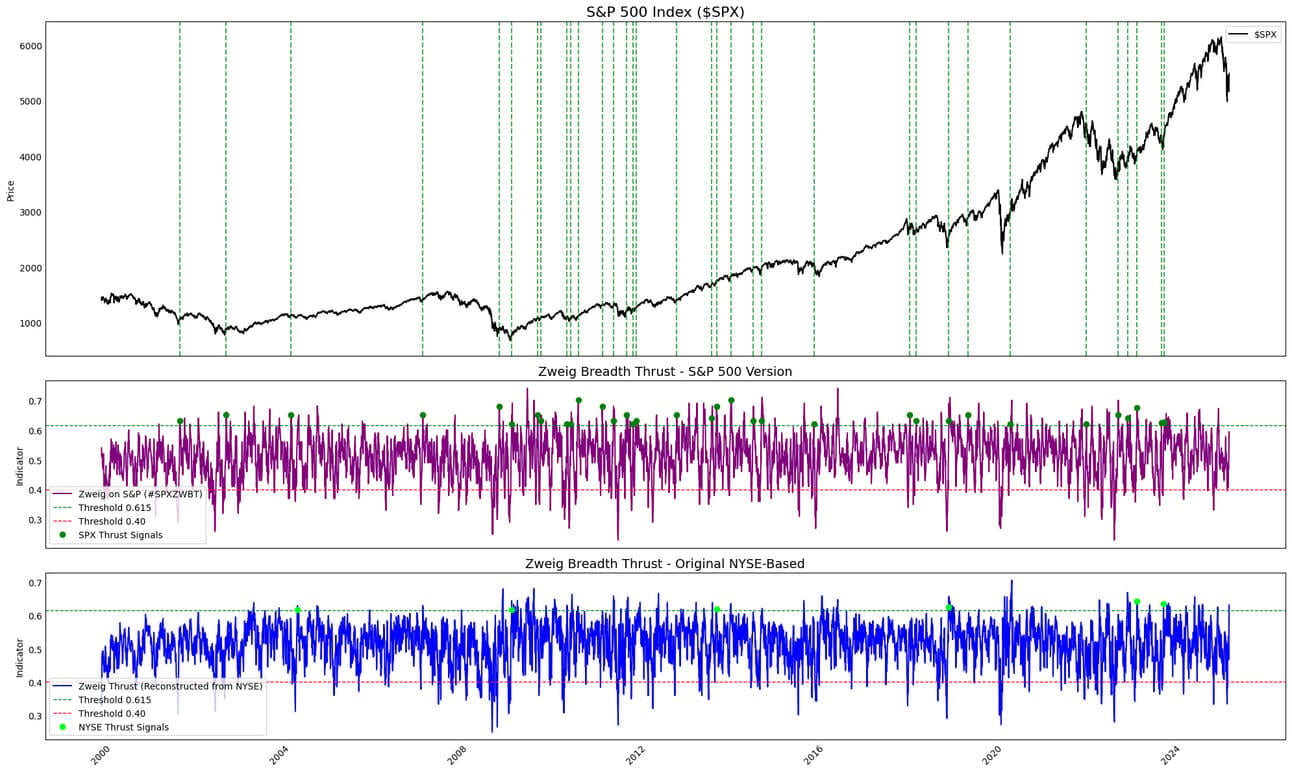
A Zweig Breadth Thrust Signal is triggered when:
- The 10-day EMA of the breadth ratio falls below 0.40, and
- Rallies above 0.615 within 10 trading days
Ok, I am back. This is where things get interesting. As you can see in the middle of the chart, there is no Zweig Thrust Index Signal on the S&P 500 data; the reading got to 0.58 below the 0.615, so I don’t know why people are calling the signal.
I include Classic Zweig, where I use the NYSE data for the indicator, but here too the signal was not triggered as it was not sufficiently oversold.
I am still waiting for a reasonable explanation why all the blabber when there wasn’t a signal using Marty’s rules.
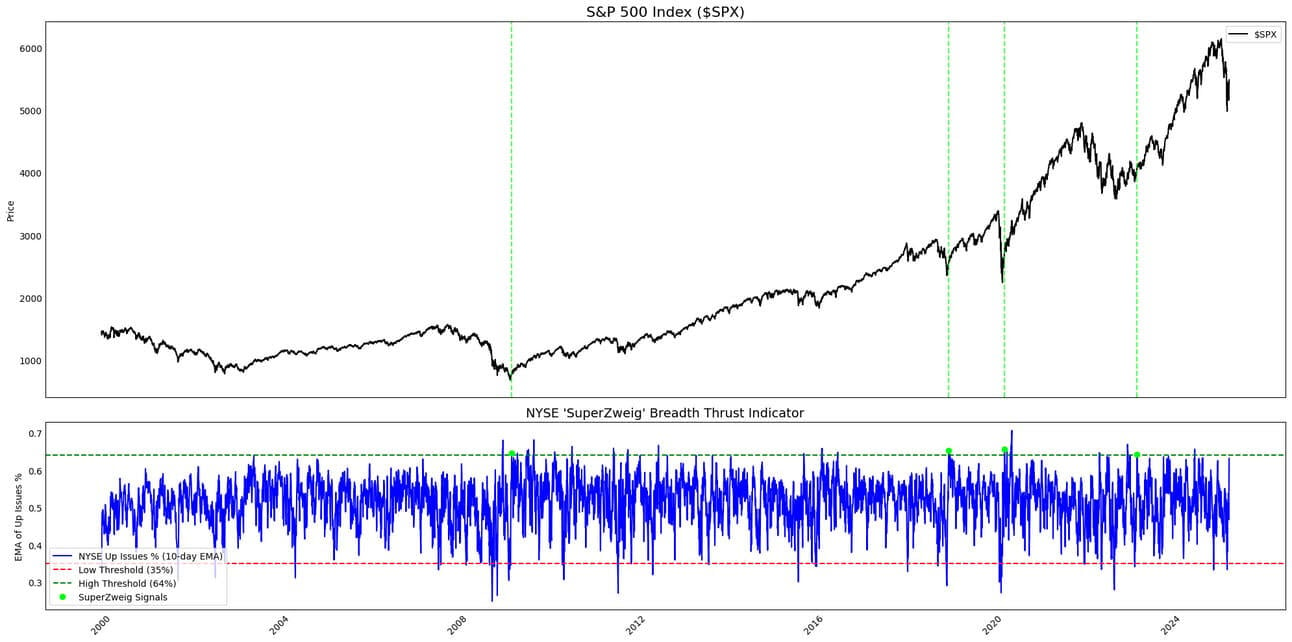
On my journey to find out why others are calling a signal, I stumbled upon an excellent analyst, Jason Goepfert, variation called SuperZweig.
A SuperZweig Signal is triggered when:
- The 10-day EMA of the Up Issues % on the NYSE
- Falls below 35%, then
- Rallies above 64% within 30 calendar days
This version extends the window from 10 days to 30 and uses slightly looser thresholds (<35% to >64%), making signals rarer and more pronounced.
I contacted Jason and await an answer, as once again I could not replicate a signal. Close, but no cigar.
S2N observations
I have to observe my wife, as it is a public holiday and I have been missing in action, I know what is good for me.
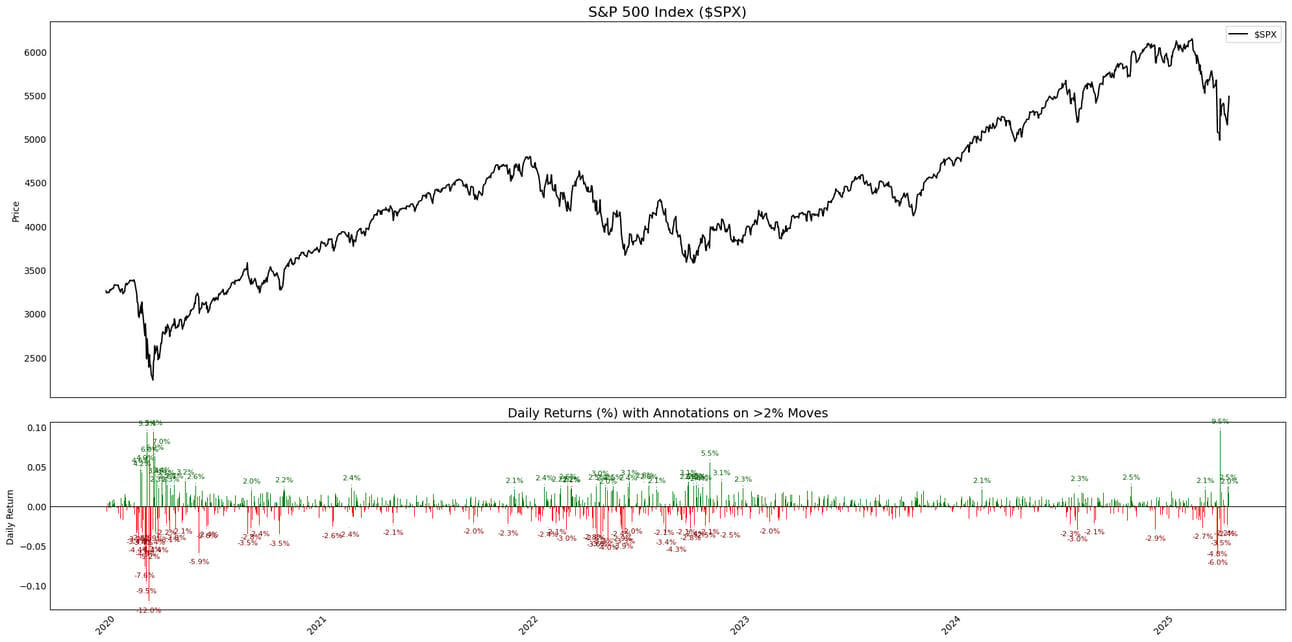
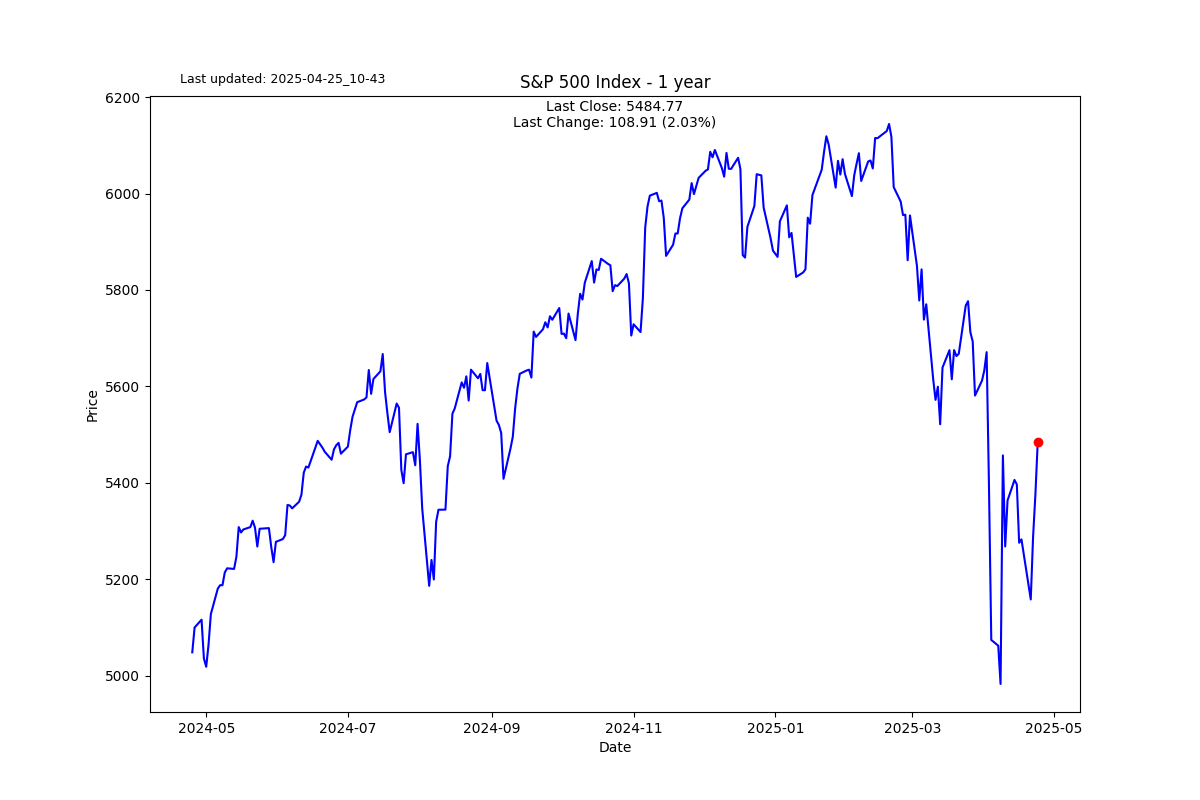
I think I have time for one observation (per eye). It seems like every second day is a 2% up or down day. I wanted to see if this is as rare as I think it is. I will let you answer that yourself.
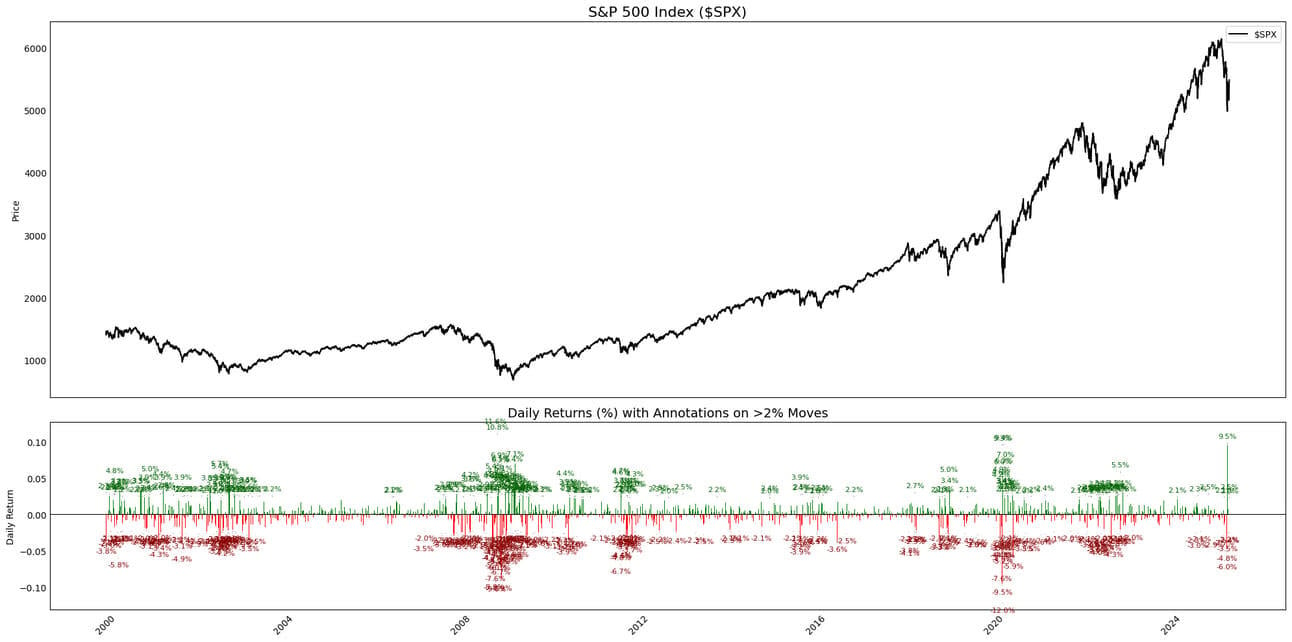
This is the same chart with more history. It is hard to see with such condensed data, but I am obsessed with context, hence the need for big data sets, enjoy.
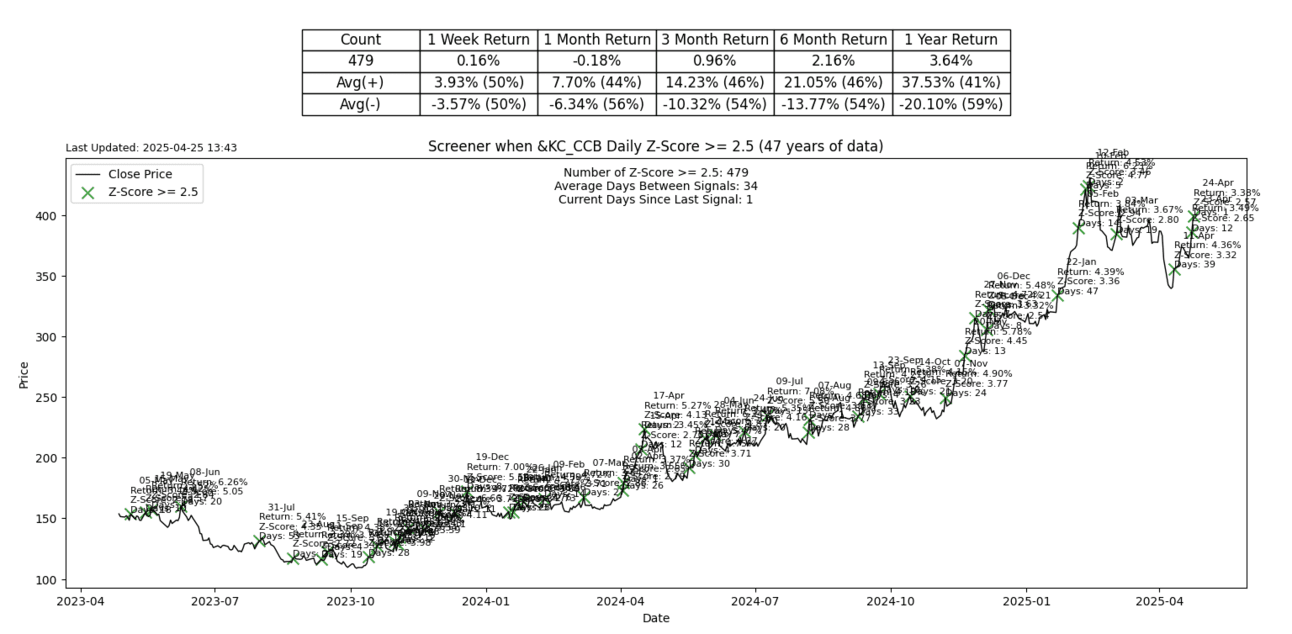
S2N screener alert
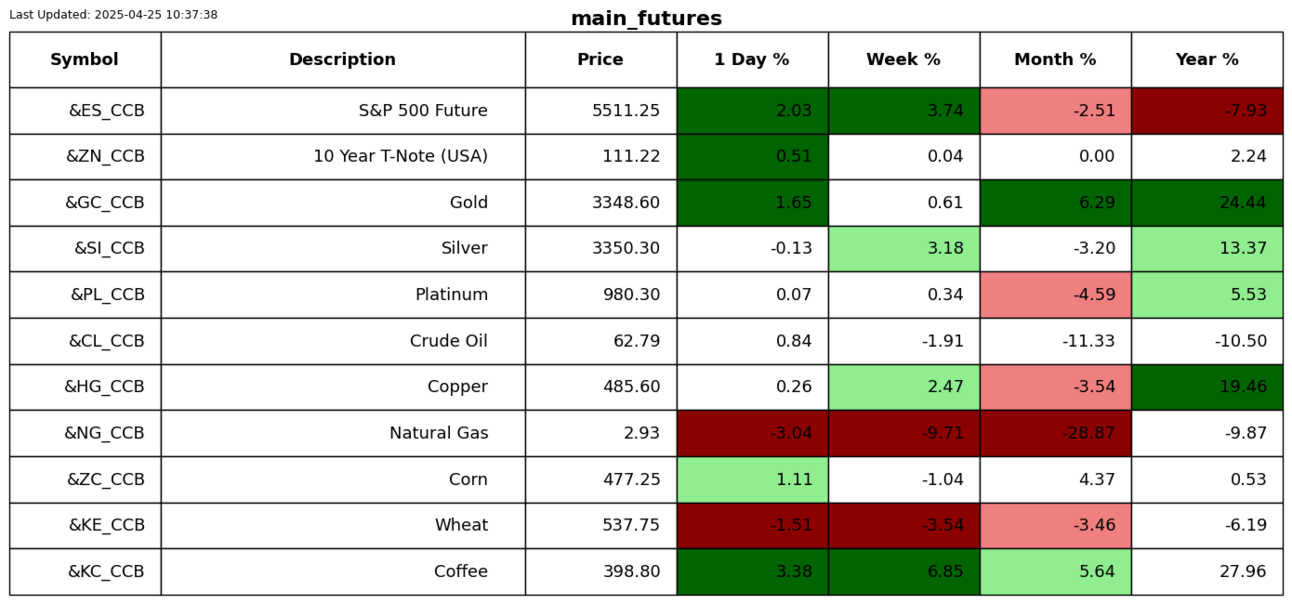
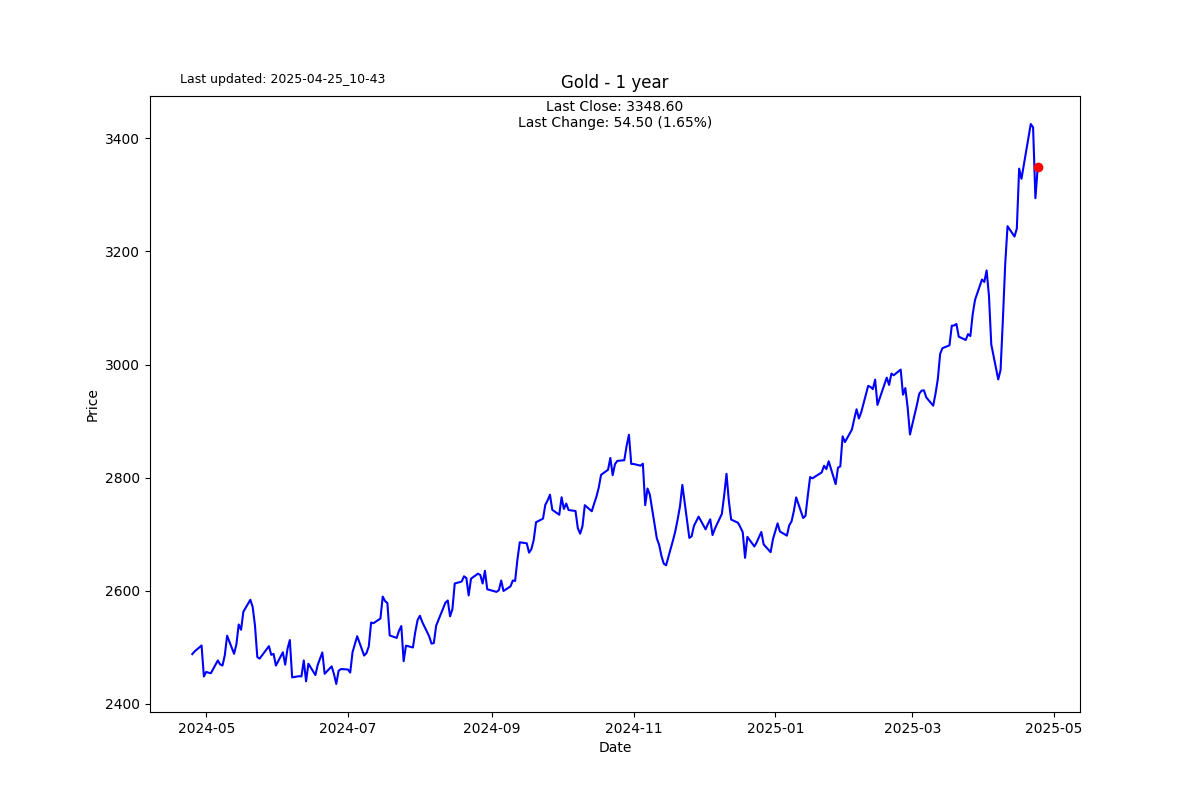
There were only 2 tickers on my list that triggered a Z-score of +-2.5 or more. One was gold, and the other was coffee.
S2N performance review

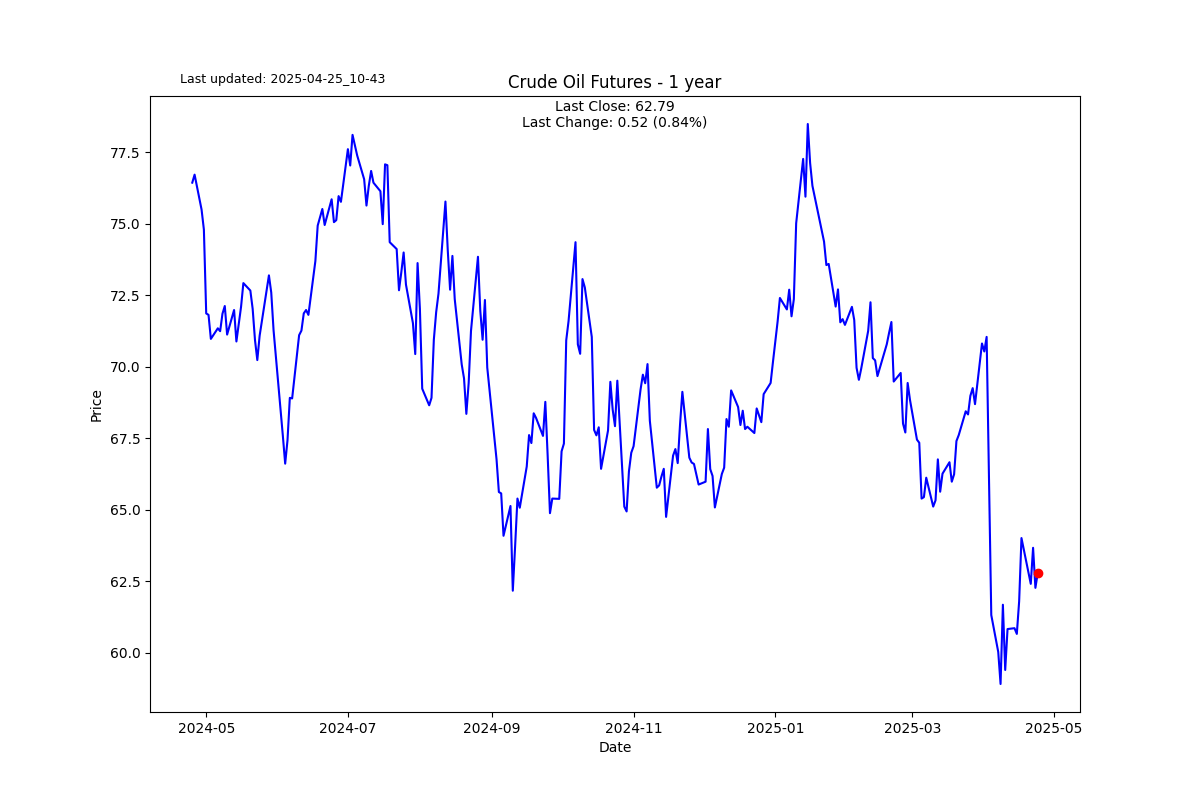
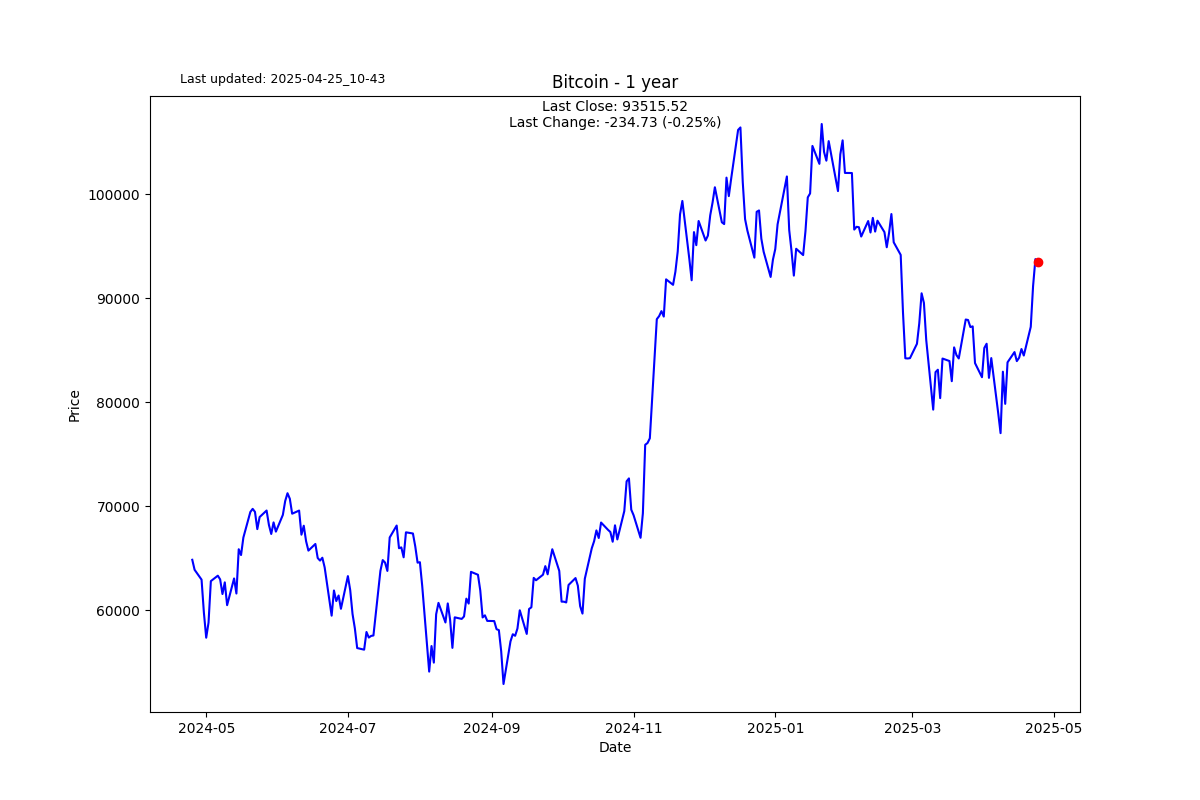
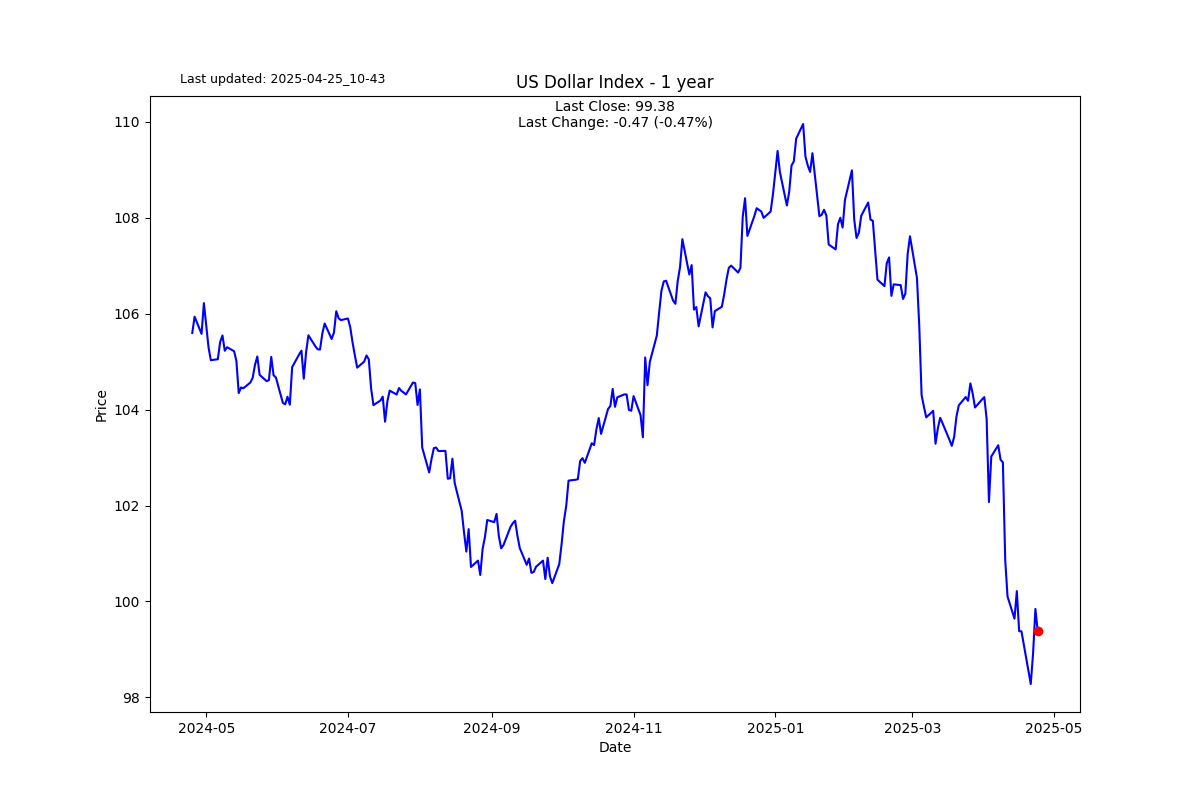
S2N chart gallery

S2N news today
Author

Michael Berman, PhD
Signal2Noise (S2N) News
Michael has decades of experience as a professional trader, hedge fund manager and incubator of emerging traders.


