US Dollar: March USD is Down at 96.135.

Energies: April '19 Crude is Down at 58.68.

Financials: The Jun 30 year bond is Down 3 tick and trading at 148.14.

Indices: The Mar S&P 500 emini ES contract is 48 ticks Lower and trading at 2799.00.

Gold: The April Gold contract is trading Up at 1316.50  Gold is 42 ticks Higher than its close.

Initial Conclusion

This is not a correlated market.  The dollar is Down-  and Crude is Down- which is not normal and the 30 year Bond is trading Lower. The Financials should always correlate with the US dollar such that if the dollar is lower then bonds should follow and vice-versa. The S&P is Lower and Crude is trading Lower which is not correlated. Gold is trading Higher which is correlated with the US dollar trading Higher. I tend to believe that Gold has an inverse relationship with the US Dollar as when the US Dollar is down, Gold tends to rise in value and vice-versa. Think of it as a seesaw, when one is up the other should be down. I point this out to you to make you aware that when we don't have a correlated market, it means something is wrong. As traders you need to be aware of this and proceed with your eyes wide open.

At this hour all Asia is trading Lower. Currently  all of Europe is trading Lower as well.

Possible Challenges To Traders Today

  • No major economic news to speak of.

  • Lack of major economic news.
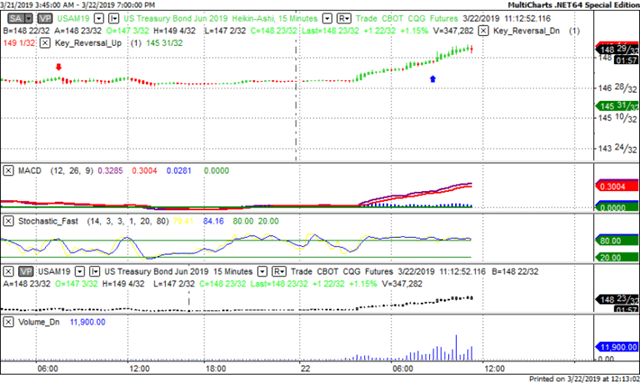
Treasuries

We've elected to switch gears a bit and show correlation between the 30 year bond (ZB) and The YM futures contract.  The YM contract is the DJIA and the purpose is to show reverse correlation between the two instruments.  Remember it's liken to a seesaw, when up goes up the other should go down and vice versa.

On Friday the ZB made a major move at around 9 AM EST.  The ZB hit a Low at around that time and the YM hit a High.  If you look at the charts below ZB gave a signal at around 9 AM EST and the YM was moving Lower at the same time. Look at the charts below and you'll see a pattern for both assets. ZB hit a Low at around 9 AM and the YM was moving Lower at the same time.  These charts represent the newest version of MultiCharts and I've changed the timeframe to a 15 minute chart to display better.  This represented a Shorting opportunity on the 30 year bond, as a trader you could have netted about 20 ticks per contract on this trade.  Each tick is worth $31.25.  Please note: the front month for the ZB contract is now June, 2019

Charts Courtesy of MultiCharts built on an AMP platform.

Chart


YM

Bias

On Friday we gave the markets a Neutral bias as nothing appeared to be correlated.  The Dow dropped 460 points and the other indices lost ground as well.  Today we aren't dealing with a correlated market and our bias is Neutral.

Could this change? Of Course.  Remember anything can happen in a volatile market. 

Commentary

So what caused such a massive selloff on Friday?  Someone noticed that the yield curve on longer term bonds were below the yield for shorter term instruments.  This struck fear into the hearts of traders as this is indicative of recession in the future.  When is anyone's guess but the last time this happened was 2006 and in December, 2007 the Great Recession started.  What do we believe?  We believe that a one day event doesn't predict the future.  From our point of view we need to see this occur over an extended period of time to deem validity.  So we'll be on the lookout for a repeat of this but for the time being, it's a one day wonder....


Trading performance displayed herein is hypothetical. The following Commodity Futures Trading Commission (CFTC) disclaimer should be noted.

Hypothetical performance results have many inherent limitations, some of which are described below. No representation is being made that any account will or is likely to achieve profits or losses similar to those shown.

In fact, there are frequently sharp differences between hypothetical performance results and the actual results subsequently achieved by any particular trading program. One of the limitations of hypothetical performance trading results is that they are generally prepared with the benefit of hindsight.

In addition, hypothetical trading does not involve financial risk, and no hypothetical trading record can completely account for the impact of financial risk in actual trading. For example, the ability to withstand losses or to adhere to a particular trading program in spite of trading losses are material points which can also adversely affect actual trading results.

There are numerous other factors related to the markets in general or to the implementation of any specific trading program which cannot be fully accounted for in the preparation of hypothetical performance results and all of which can adversely affect actual trading results.

Trading in the commodities markets involves substantial risk and YOU CAN LOSE A LOT OF MONEY, and thus is not appropriate for everyone. You should carefully consider your financial condition before trading in these markets, and only risk capital should be used.

In addition, these markets are often liquid, making it difficult to execute orders at desired prices. Also, during periods of extreme volatility, trading in these markets may be halted due to so-called “circuit breakers” put in place by the CME to alleviate such volatility. In the event of a trading halt, it may be difficult or impossible to exit a losing position.

Recommended Content


Recommended Content

Editors’ Picks

EUR/USD clings to gains near 1.0700, awaits key US data

EUR/USD clings to gains near 1.0700, awaits key US data

EUR/USD clings to gains near the 1.0700 level in early Europe on Thursday. Renewed US Dollar weakness offsets the risk-off market environment, supporting the pair ahead of the key US GDP and PCE inflation data. 

EUR/USD News

USD/JPY keeps pushing higher, eyes 156.00 ahead of US GDP data

USD/JPY keeps pushing higher, eyes 156.00 ahead of US GDP data

USD/JPY keeps breaking into its highest chart territory since June of 1990 early Thursday, recapturing 155.50 for the first time in 34 years as the Japanese Yen remains vulnerable, despite looming intervention risks. The focus shifts to Thursday's US GDP report and the BoJ decision on Friday. 

USD/JPY News

Gold price lacks firm intraday direction, holds steady above $2,300 ahead of US data

Gold price lacks firm intraday direction, holds steady above $2,300 ahead of US data

Gold price remains confined in a narrow band for the second straight day on Thursday. Reduced Fed rate cut bets and a positive risk tone cap the upside for the commodity. Traders now await key US macro data before positioning for the near-term trajectory.

Gold News

Injective price weakness persists despite over 5.9 million INJ tokens burned

Injective price weakness persists despite over 5.9 million INJ tokens burned

Injective price is trading with a bearish bias, stuck in the lower section of the market range. The bearish outlook abounds despite the network's deflationary efforts to pump the price. Coupled with broader market gloom, INJ token’s doomed days may not be over yet.

Read more

Meta takes a guidance slide amidst the battle between yields and earnings

Meta takes a guidance slide amidst the battle between yields and earnings

Meta's disappointing outlook cast doubt on whether the market's enthusiasm for artificial intelligence. Investors now brace for significant macroeconomic challenges ahead, particularly with the release of first-quarter gross domestic product (GDP) data on Thursday.

Read more

Majors

Cryptocurrencies

Signatures