Good Morning Traders,

As of this writing 4 AM EST, here’s what we see:

US Dollar: Sept. USD is Down at 94.280.
Energies:
Jul '18 Crude is Up at 66.17.
Financials:
The Sept 30 year bond is Down 11 ticks and trading at 143.20.
Indices:
The Sept S&P 500 emini ES contract is 40 ticks Higher and trading at 2762.50.
Gold:
The Aug gold contract is trading Down at 1270.40. Gold is 2 ticks Lower than its close.

Initial Conclusion

This is not a correlated market. The dollar is Down- and Crude is Up+ which is normal and the 30 year Bond is trading Lower. The Financials should always correlate with the US dollar such that if the dollar is lower then bonds should follow and vice-versa. The S&P is Higher and Crude is trading Higher which is not correlated. Gold is trading Down- which is not correlated with the US dollar trading Down-. I tend to believe that Gold has an inverse relationship with the US Dollar as when the US Dollar is down, Gold tends to rise in value and vice-versa. Think of it as a seesaw, when one is up the other should be down. I point this out to you to make you aware that when we don't have a correlated market, it means something is wrong. As traders you need to be aware of this and proceed with your eyes wide open.

At this hour all of Asia is trading mainly Higher with the exception of the Nikkei and Singapore exchanges which are lower at this time. Currently all of Europe is trading Higher.

Possible Challenges To Traders Today

  • Flash Manufacturing PMIis out at 9:45 AM EST. This is major.

  • Flash Services PMI is out at 9:45 AM EST. This is major.
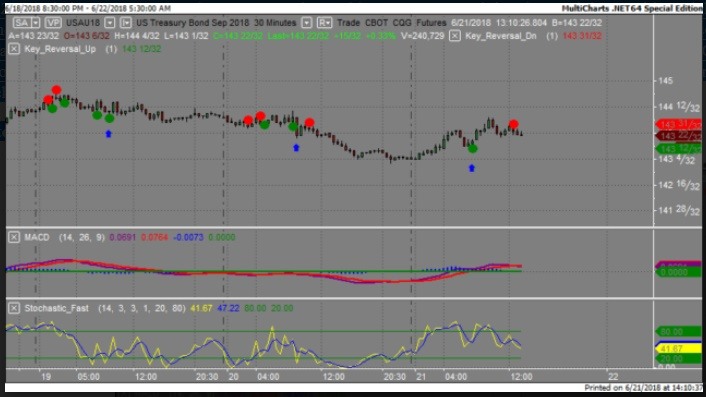
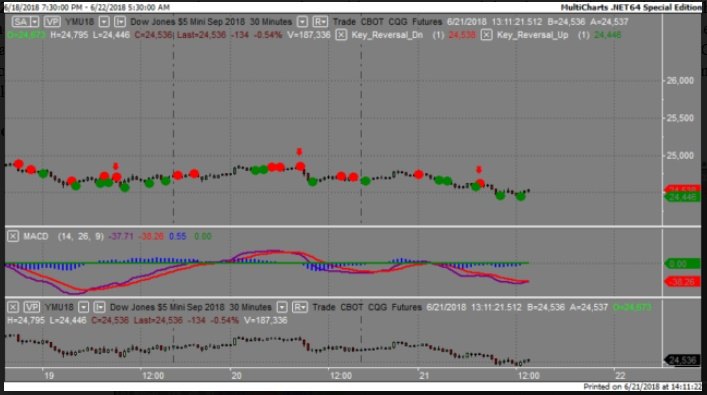
Treasuries

We've elected to switch gears a bit and show correlation between the 30 year bond (ZB) and The YM futures contract. The YM contract is the DJIA and the purpose is to show reverse correlation between the two instruments. Remember it's liken to a seesaw, when up goes up the other should go down and vice versa.

Yesterday the ZB made it's move at around 8 AM EST. The ZB hit a Low at around that time and the YM hit a High. If you look at the charts below ZB gave a signal at around 8 AM EST and the YM was moving Lower at the same time. Look at the charts below and you'll see a pattern for both assets. ZB hit a Low at around 8 AM and the YM was moving Lower at the same time. These charts represent the newest version of MultiCharts and I've changed the timeframe to a 30 minute chart to display better. This represented a long opportunity on the 30 year bond, as a trader you could have netted about 20 ticks per contract on this trade. Each tick is worth $31.25.

Charts Courtesy of MultiCharts built on an AMP platform.

Tea

Tea

Bias

Yesterday we gave the markets a Neutral bias as the indices didn't seem to have any sense of direction Thursday morning. The Dow lost 196 points and the other indices lost ground as well. Today we aren't dealing with a correlated market however our bias is to the Upside.

Could this change? Of Course. Remember anything can happen in a volatile market.

Commentary

Yesterday morning the S&P, Nasdaq and Dow were all trading higher in the pre market. However this quickly changed as the morning wore on. Once again the fear of a looming trade war is dominating the markets and the Smart Money doesn't like it. Who is the Smart Money? All the institutionals who have much to lose if in fact a trade war erupts. At some point the market will rebound. When will that be? No one can say but we will strive to keep you abreast as events unfold.

Trading performance displayed herein is hypothetical. The following Commodity Futures Trading Commission (CFTC) disclaimer should be noted.

Hypothetical performance results have many inherent limitations, some of which are described below. No representation is being made that any account will or is likely to achieve profits or losses similar to those shown.

In fact, there are frequently sharp differences between hypothetical performance results and the actual results subsequently achieved by any particular trading program. One of the limitations of hypothetical performance trading results is that they are generally prepared with the benefit of hindsight.

In addition, hypothetical trading does not involve financial risk, and no hypothetical trading record can completely account for the impact of financial risk in actual trading. For example, the ability to withstand losses or to adhere to a particular trading program in spite of trading losses are material points which can also adversely affect actual trading results.

There are numerous other factors related to the markets in general or to the implementation of any specific trading program which cannot be fully accounted for in the preparation of hypothetical performance results and all of which can adversely affect actual trading results.

Trading in the commodities markets involves substantial risk and YOU CAN LOSE A LOT OF MONEY, and thus is not appropriate for everyone. You should carefully consider your financial condition before trading in these markets, and only risk capital should be used.

In addition, these markets are often liquid, making it difficult to execute orders at desired prices. Also, during periods of extreme volatility, trading in these markets may be halted due to so-called “circuit breakers” put in place by the CME to alleviate such volatility. In the event of a trading halt, it may be difficult or impossible to exit a losing position.

Recommended Content


Recommended Content

Editors’ Picks

AUD/USD turns south toward 0.6400 after mixed Australian jobs data

AUD/USD turns south toward 0.6400 after mixed Australian jobs data

AUD/USD has come under renewed selling pressure and turned south toward 0.6400 after Australian employment data pointed to loosening labor market conditions, fanning RBA rate cut expectations and weighing on the Aussie Dollar. 

AUD/USD News

USD/JPY remains below 154.50 amid weaker US Dollar

USD/JPY remains below 154.50 amid weaker US Dollar

USD/JPY keeps losses for the second successive session, trading below 154.50 in Asian trading on Thursday. The pair is undermined by the latest US Dollar pullback, Japan's FX intervention risks and a softer risk tone. 

USD/JPY News

Gold price finds buyers again near $2,355 as USD licks its wounds

Gold price finds buyers again near $2,355 as USD licks its wounds

Gold price is attempting a tepid bounce in the Asian session, having found fresh demand near $2,355 once again. Gold price capitalizes on a softer risk tone and an extended weakness in the US Treasury bond yields, despite the recent hawkish Fed commentary. 

Gold News

OMNI post nearly 50% loss after airdrop and exchange listing

OMNI post nearly 50% loss after airdrop and exchange listing

Omni network lost nearly 50% of its value on Wednesday after investors dumped the token following its listing on top crypto exchanges. A potential reason for the crash may be due to the wider crypto market slump.

Read more

Investors hunkering down

Investors hunkering down

Amidst a relentless cautionary deluge of commentary from global financial leaders gathered at the International Monetary Fund and World Bank Spring meetings in Washington, investors appear to be taking a hiatus after witnessing significant market movements in recent weeks.

Read more

Majors

Cryptocurrencies

Signatures