Yen carry trade meets GDP

S&P 500 didn‘t maintain Tuesday‘s high close, and neither did Nasdaq – both put in a series of failed premarket relief attempts with altogether three intraday upswings from Thursday‘s panic lows – yet these failed as well. When it was clear the last one was about to go the way of dodo bird, short positioning focused on S&P 500 and Russell 2000 was rewarded for the following hours (in intraday terms).
It‘s that I expect today‘s GDP and GDP price index to turn benign to the bulls, and to be supportive of "Fed should cut now to support the economy as inflation isn't biting nearly as badly as the economy is slowing down to crawl speed" (even 1.7% GDP growth is stall speed) – with all that brings to rate cutting odds, with of course some markets benefiting more than others.
And that‘s the subject of today‘s article – which.
Let‘s move right into the charts – today‘s full scale article contains 4 more of them, with commentaries.
Tired of seeing those red boxes instead of way more valuable information? Try the premium services based on what and how you trade.
S&P 500 and Nasdaq
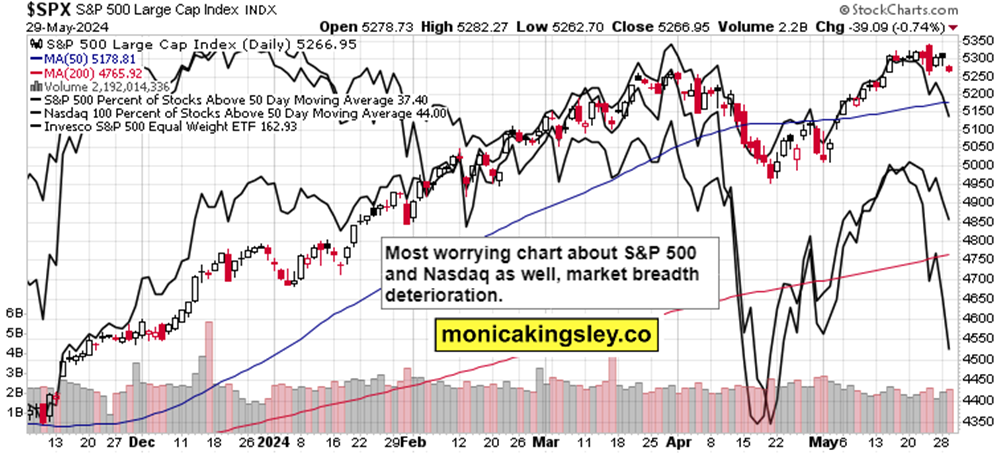
It‘s not only about the percentage of stocks trading above 50-day moving averages in both indices, not about equal weighted S&P 500, but about new highs new lows and advance-decline line with volume all making lower highs on modestly up days or divergencies in a longer series. BoJ driven repricing is then a cherry on the cake.
Author

Monica Kingsley
Monicakingsley
Monica Kingsley is a trader and financial analyst serving countless investors and traders since Feb 2020.


