Yellen, the Dot Plots and some R-E-S-P-E-C-T
Stocks finished a bit lower yesterday - led by energy (XLE), Financials (XLF) and Healthcare (XLV) - following comments made by Chicago's FED President Charlie Evans - over the course of interest rate hikes (think Dot Plot Graph) and more back and forth in DC over the course of healthcare reform..............Now while it was not a disaster - the Dow lost 8 pts, the S&P gave back 4, the Nasdaq ended flat, the Russell lost 7 and the Transports shed 44 pts.....you can feel the exhaustion in the mkt.....the excitement that existed over the past couple of months is now turning to frustration...and frustration leads to re-assessment.....
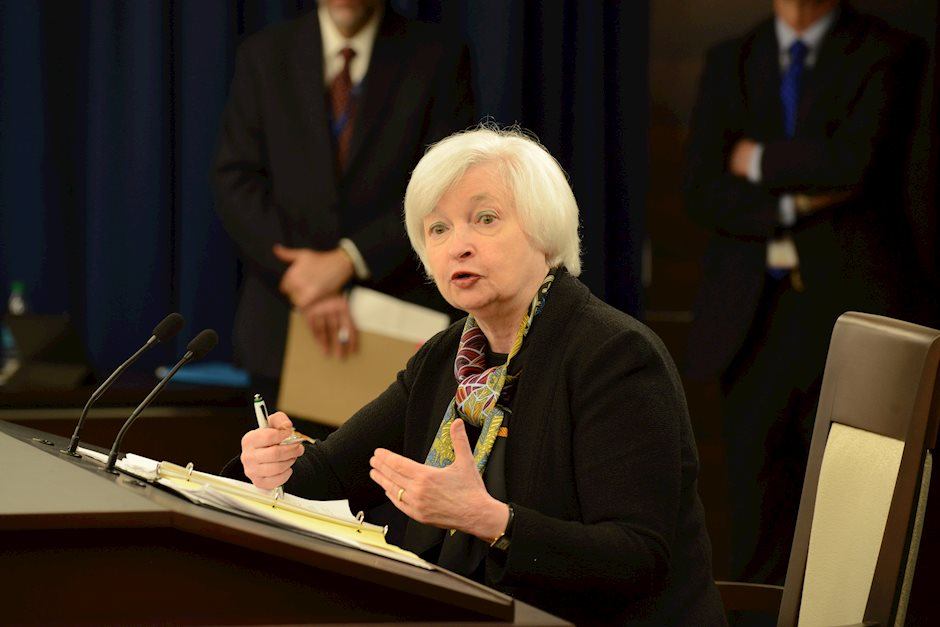
So listen - you will be hearing a lot about the FED Dot Plot Graph in the coming days - as the parade of FED speakers hits the media circuit - each one hinting at which 'dot' they represent on the graph....It will end with Janet's speech on Thursday where she is sure to get the crowd riled up with her own version of the incomparable Aretha Franklin's 'Respect'...as the crowd continues to try and read between the lines.....as she belts it out:
"What you want, Baby, I got it, What you need, Do you know I got it, All I'm askin', Is for a little respect when you get home (just a little bit)...I' m about to give you all of my money, And all I'm askin' in return, honey, Is to give me my propers, When you get home (just a, just a, just a, just a), Yeah baby (just a, just a, just a, just a), When you get home (just a little bit), Yeah (just a little bit), Ooo, your kisses, Sweeter than honey, And guess what? So is my money...all I want is a little - R-E-S-P-E-C-T"
Now for those of you who are not aware of the Dot Plot Graph - let me lay it out....since it has become one of the 'most watched' data points by all the paparazzi....
The Dot Plot graph - published after every meeting - reflects the views and projections of the 16 members of the FOMC (Federal Open Market Committee) - which is THE rate setting body within the FED. In simple terms - a dot plot graph is a statistical chart consisting of data points (those data points are the individual projections of each FED member on where they think fed funds should be at the end of various calendar years) plotted on a simple scale - typically little round dots that look like a graph that you might draw in elementary school...although today it is drawn by an expensive computer and is set to look all fancy and official - but in the end - it is just a bunch of dots plotted on a piece of paper. This graph is supposed to represent the FED's efforts at being more transparent.....oh boy....
And yesterday we got the first dot plot 'reveal'....because part of the game is trying to figure out which dot belongs to which member - and this way you have a sense of who is more hawkish and who is more dovish and where the balance of power is tilted for the future....(Look - they do not want everyone to know exactly how they feel - so they use the dot plot graph and live interviews to spread the word....)
So yesterday - Chicago's Charlie Evans revealed that he (while usually fairly dovish) has now switched sides and is batting for the other team. When asked directly what we should expect - he said-
"I think 3 is entirely possible. As I gain more confidence in the outlook, I could support three total this year." Now - that was not so dramatic - until he said that he 'could even see four hikes as a possibility'...saying that
'if inflation picks up or oil prices shoot up then we can be sure that the FED will get aggressive with rates..... ' (more on oil below).
Now look - the current dot plot graph has only 3 members below the 3 hike line.....One is definitely Minneapolis's Neely Khashkari - did you see him talking in circles yesterday morning on CNBC's Squawk Box? Another is considered to be Daniel Tarullo - who you have to discount because he is retiring in April - meaning that his 'dot' doesn't really carry any weight...so that means that there are 13 dots that are ABOVE the 3 rate hike line.....which brings me back to the 4 or 5 possible 25 bps hikes this year - IF the data demands it...and that is the wild card...and that is not what the mkt is currently expecting....which is why I think we have been seeing some weakness in the mkt of late....
Now we can also attribute the weakness to the circus going on in DC.....and it is a circus....between the tweets, accusations, road blocks, chest pounding, mudslinging - it only serves to give the late night shows and SNL plenty of fodder for entertainment.... Promised reforms are hitting a road block as it appears that Congress is working hard to stall the process..........the first go around on Healthcare Reform is .....well let's say a disaster - and healthcare stocks are getting slammed - the XLV (Healthcare ETF) is now down 2.5% in the last week - and will continue to be volatile depending on who is speaking.... Tax Reform? Economic Reforms? Well they appear to be on the back burner for now and this is going to a big deal because so much of this rally since the election - is all about the coming reforms......and while they may come - they may not come nearly as fast as investors anticipated so the mkt will adjust (think time value of money)....
Geo-Politics? Throw those in and you have a very volatile mix....the recent rhetoric surrounding North Korea, China and South Korea are cause for concern....but Rexxy (Tillerson - Secretary of State) does appear to be a man in control, a 'take no prisoners' type of guy that is ready to put his money where his mouth is.....and put Chubby (Kim Jung On) in his place...with or without the help of the Chinese.....So the question now is - Will the Chinese do the right thing or will they side with Chubby? This is China's moment to shine, this is their opportunity to join the 'free world' and do the right thing....Let's see what happens....
And Oil? Down again yesterday (0.53cts) as we learned that the US has added more oil rigs for 9 straight weeks ....the number of US rigs drilling for oil went up again last week - bringing the total to 631 rigs...or 63% higher than last year..... and that only supports the argument that the US is ready to make up for any of the OPEC cuts as we add more rigs to the landscape.....and guess who is NOT happy? (Think the Saudi's). So unless Oil explodes higher then pressure on inflation should weaken....but remember - the gov't reports on inflation figures EX food and energy - as those components can be very volatile and by eliminating them - they can 'smooth out' the reading......
The dollar is weaker this morning - currently down 0.62 at 99.79 or more than 2% since early March...which is a bit confusing because higher interest rates will send the dollar higher...so is the DXY suggesting that the Dot Plot Graph is BS? Is it suggesting that the US economy is about to enter a recession which will force the FED to CUT rates? (Lower rates will put pressure on the dollar while higher rates will send the dollar higher).
US futures are trading modestly higher - currently up 3 pts - this appearing to be in concert with European shares after anti-Euro, French presidential candidate Marine Le Pen was defeated in her first debate by Center candidate Emmanuel Macron, easing European investor concerns that she may win Spring elections. There are 3 FED speakers today....Kansas City's Ester George at 12 pm, Cleveland's Loretta Mester at 6 pm and Boston's Eric Rosengren at 9:45 pm - If they say anything at all - it will have to wait until tomorrow for the mkts to reflect where they lie on the Dot Plot graph......No eco reports so the action will continue to be driven by DC and the international political debates....
As the talk turns more hawkish I would expect the mkt to test the February highs/ March lows of 2360..if we breach that then a move back to the 50 dma at 2325 would not be out of the question. Considering that there is no real catalyst right now - do not look for the mkt to make new highs but rather use 2375 as resistance.
European mkts are a bit higher as noted on the back of the French debates...UK PM Theresa May has now pinned March 29th as D-Day for her to elect Article 50 - the beginning of BREXIT - so look for more commentary on how she intends on divorcing herself from the EU.........FTSE +0.44%, CAC 40 +0.32%, DAX +0.07%, EUROSTOXX +0.44%, SPAIN +0.78% and ITALY +1%.
Take Good Care
KP
Veal Saltimbocca
This is a classic Roman dish and is so easy to serve for company. You can put it over a bed of sauteed spinach and it makes a beautiful presentation...try it, Won't you?
For this you need: Thinly sliced Prosciutto, Pounded veal scallopini, Sage leaves, butter, olive oil, chicken stock and white wine
Begin by placing a slice of prosciutto on each veal slice, and then place a sage leaf on top of that. Thread a toothpick through the three layers, holding the sage and prosciutto onto the veal.
Heat butter, and the oil in a heavy frying pan until hot. Add the veal in a single layer, prosciutto side down. Sauté until the prosciutto is slightly crisp and brown, around two minutes. Turn, and cook on the other side for an additional minute. Remove from the pan, and keep warm and covered.
Now add 1 cup of white wine. Deglaze the pan by scraping up the browned bits from the bottom, cook until it has reduced by half. Now add 1/2 cup of chicken stock, and cook over high heat until it has reduced by half.
Whisk in 2 tblspn of butter, and then return the saltimbocca to the pan to re-warm.
Remove the toothpicks and the sage and transfer to a serving plate, prosciutto side up.
Pour the pan juices over the meat, and serve immediately.
Buon Appetito.
Author

Kenny Polcari
KennyPolcari.com


