Yearly technical outlook – EUR/USD, GBP/USD, US100 [Video]
- EUR/USD: +12% in 2025; 2026 depends on Fed cuts vs ECB hold.
- GBP/USD: rose on dollar weakness; 2026 pressured by weak growth and BoE easing.
- US100: +22% in 2025; 2026 bullish but volatile.
![Yearly technical outlook – EUR/USD, GBP/USD, US100 [Video]](https://editorial.fxsstatic.com/images/i/eur-usd-001_XtraLarge.jpg)

EUR/USD
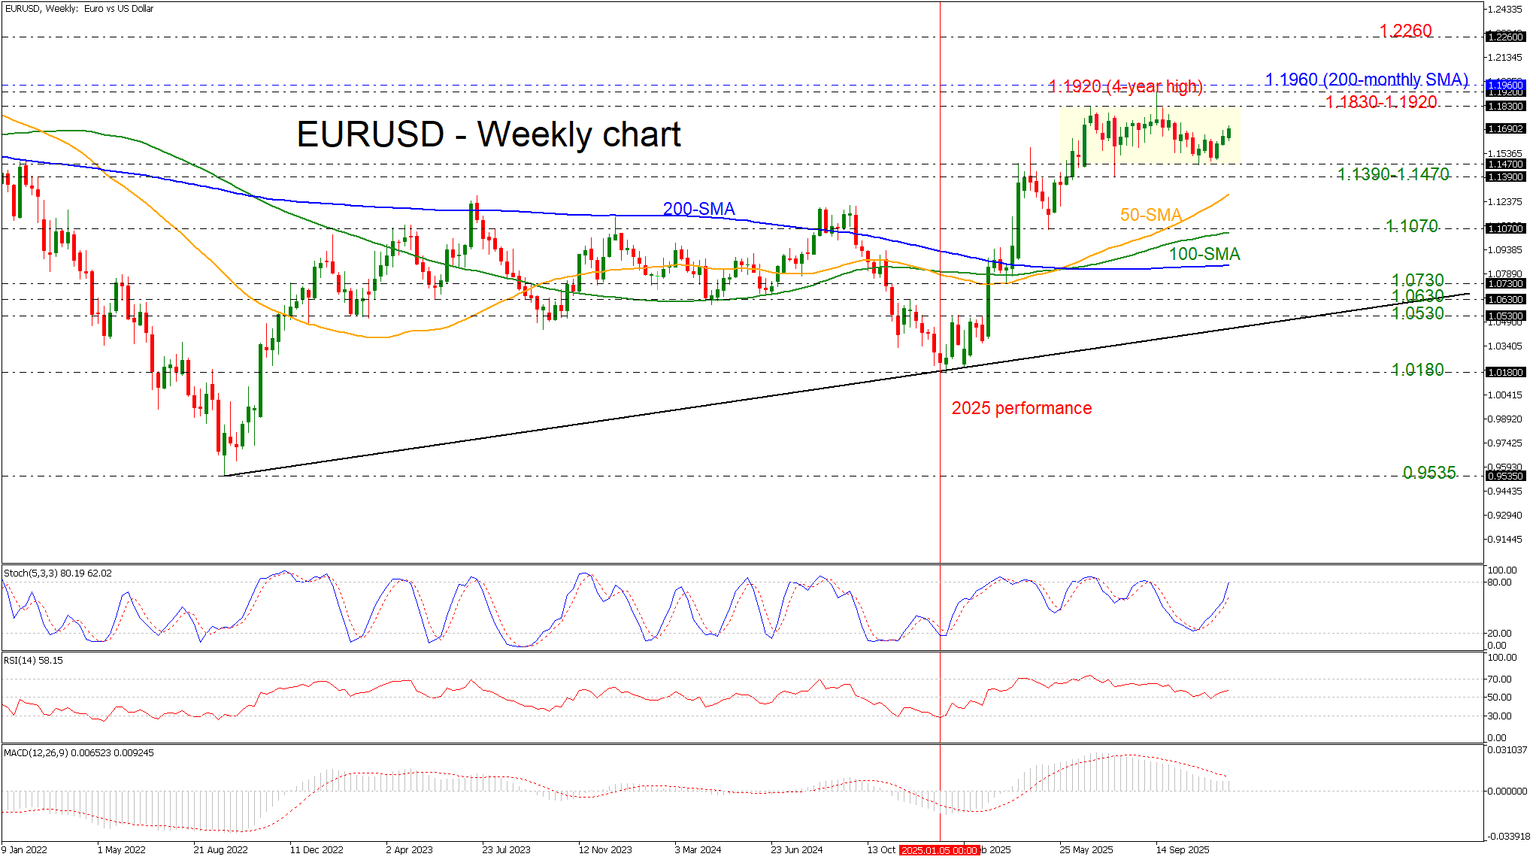
EUR/USD rebounded strongly in 2025, gaining about 12% as fears of a U.S. recession and stable Eurozone inflation supported the euro early in the year. However, late strength in the U.S. economy and a slower Fed easing cycle capped gains. In 2026, policy divergence will dominate: the Fed is expected to cut rates aggressively, while the ECB likely stays on hold. Still, risks such as European political uncertainty, weak fiscal stimulus impact, and a possible dovish ECB shift could weigh on the euro.
From a technical standpoint, EURUSD has been in a sideways channel over the last six months, with the upper boundary at 1.1830 and the lower boundary at the 1.1470 support level. The longer-term outlook remains bullish but needs a significant boost to continue the upside structure toward the four-year high at 1.1920 and the 200-month simple moving average (SMA) at 1.1960. During 2026, the pair may rally toward the next resistance barrier of 1.2260, registered in May 2021.
However, a drop below the consolidation area and the 1.1390–1.1470 support zone would increase downside momentum, testing the 50-week SMA at 1.1280 ahead of the 100-week SMA at 1.1070. In case of deeper corrections, the pair has more room to fall, but the broader outlook would remain bullish unless there is a breach of 1.0530, which stands near the long-term uptrend line.
GBP/USD
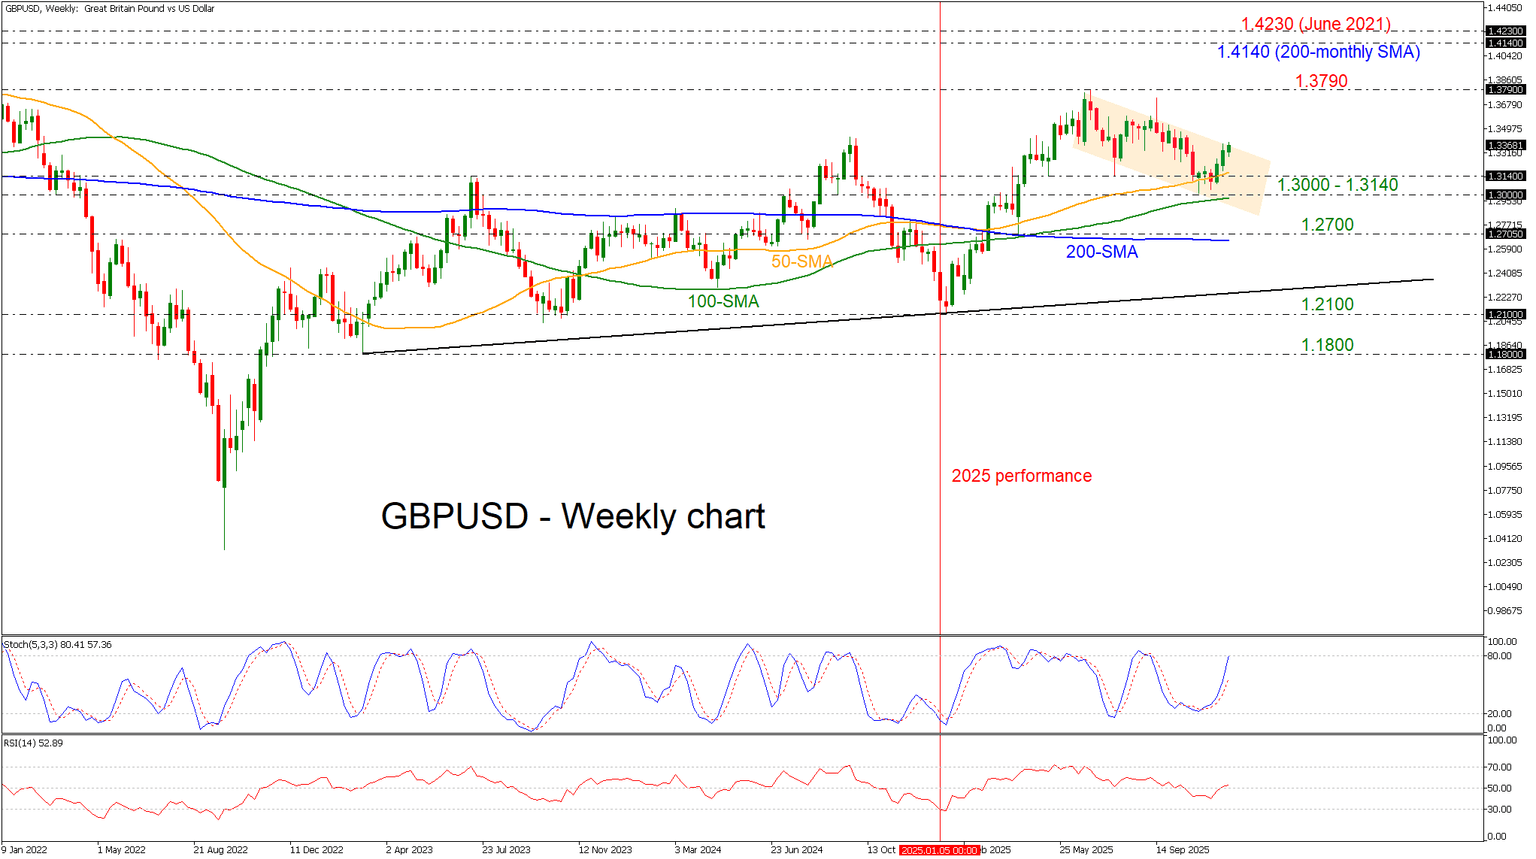
GBPUSD gained in 2025 as the pound capitalized on dollar weakness despite domestic challenges and a slowing U.K. economy. Early-year support faded as growth concerns deepened and the Bank of England shifted to rate cuts, leaving sterling vulnerable. Looking ahead to 2026, the outlook is less optimistic: weaker U.K. growth and expectations of more aggressive BoE easing could keep sterling under pressure.
Political risks, including May’s local elections testing Labour’s cohesion, are adding to uncertainty. While any dollar softness from a dovish Fed Chair may offer temporary relief, FX forwards signal an accelerated GBPUSD decline in the second half of the year.
On the weekly chart, GBPUSD has been in a descending channel since it peaked at 1.3790 at the end of June, rebounding off the 1.3000 and the 50- and 100-week SMAs recently. A climb above the channel would endorse the long-term bullish scenario, raising the likelihood of another touch of 1.3790 and then the 200-month SMA at 1.4140. On the flip side, a drop below 1.3000 could see investors testing the 1.2700 handle, which stands near the 200-week SMA ahead of the uptrend line near 1.2300.
US100
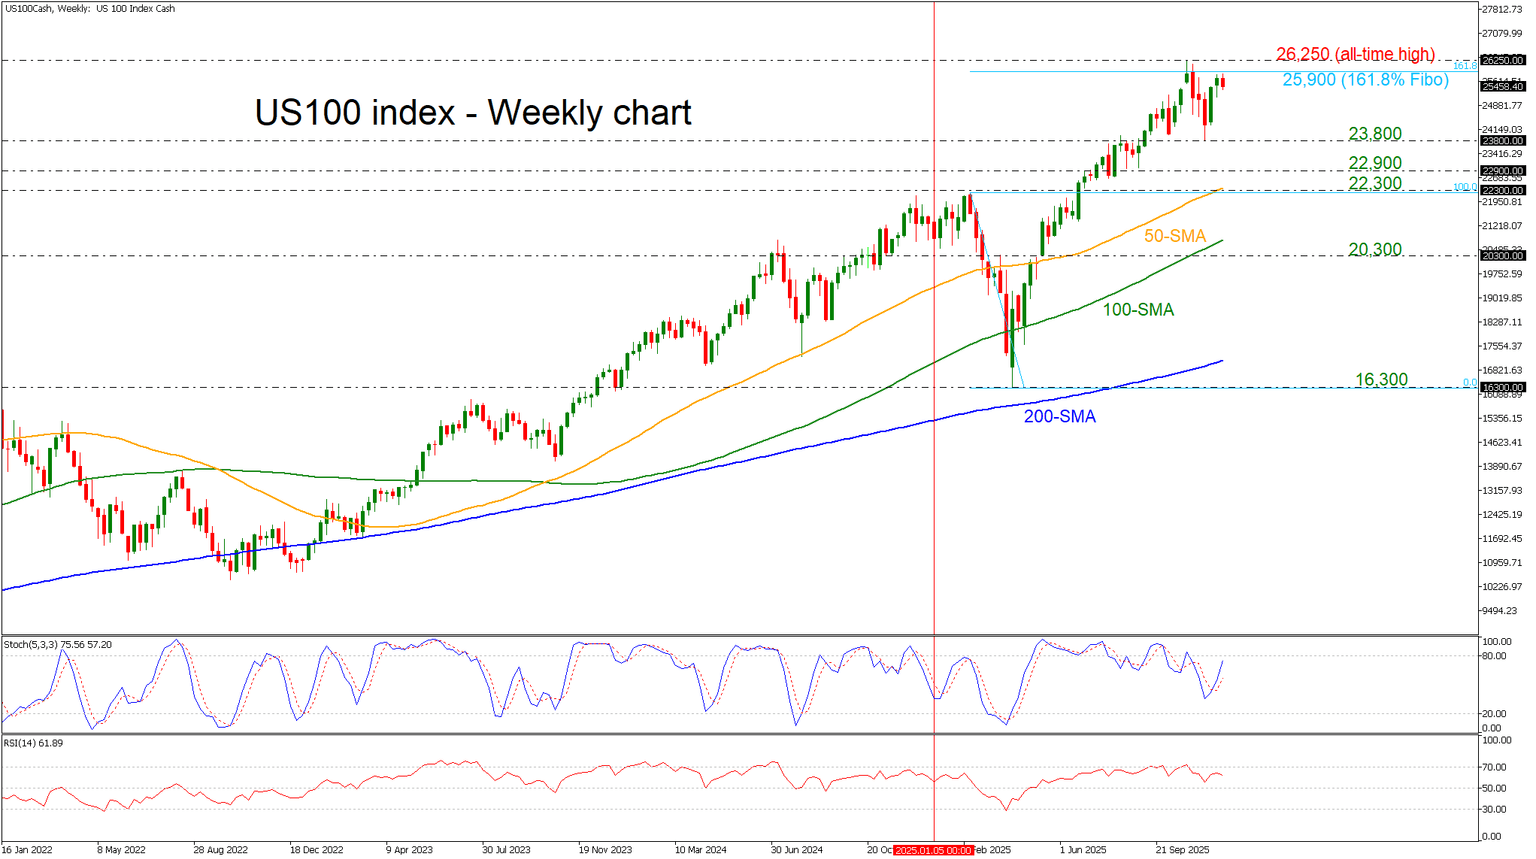
The US100 index delivered an impressive 22% gain in 2025, extending its bullish momentum and outperforming both the US500 and US30. This surge was powered by strong demand for AI and cloud technologies, with NVIDIA leading early gains and Alphabet, Microsoft, and Amazon riding the wave of cloud adoption. Even consumer tech giants like Apple and Meta contributed to the rally, despite headwinds from inflation concerns and tariff uncertainty earlier in the year. The market rebounded sharply after the Fed shifted to an easing stance, cutting rates three times and ending quantitative tightening, which supported lofty valuations.
Looking ahead to 2026, optimism persists as further Fed rate cuts and fiscal stimulus, such as corporate tax relief, are expected to bolster earnings growth. However, stretched valuations and historical midterm volatility, coupled with risks like trade tensions and potential government shutdowns, suggest that while the trend remains bullish, investors should brace for heightened volatility and monitor earnings sustainability.
Technically, the US100 index maintained a bullish trend in 2025, posting new all-time highs several times. Currently, the price is testing the 25,900 resistance level, which is the 161.8% Fibonacci extension of the downward wave from 22,300 to 16,300. Further increases could open the door for another test of the record high at 26,250 before rallying to the 261.8% Fibonacci level at 31,900. The round numbers before that level, such as 28,000 and 30,000, may prove to be significant hurdles for traders. A downside retracement could reach the 23,800 and 22,900 barriers ahead of 22,300, which coincides with the 50-week SMA.
Author

Melina joined XM in December 2017 as an Investment Analyst in the Research department. She can clearly communicate market action, particularly technical and chart pattern setups.


