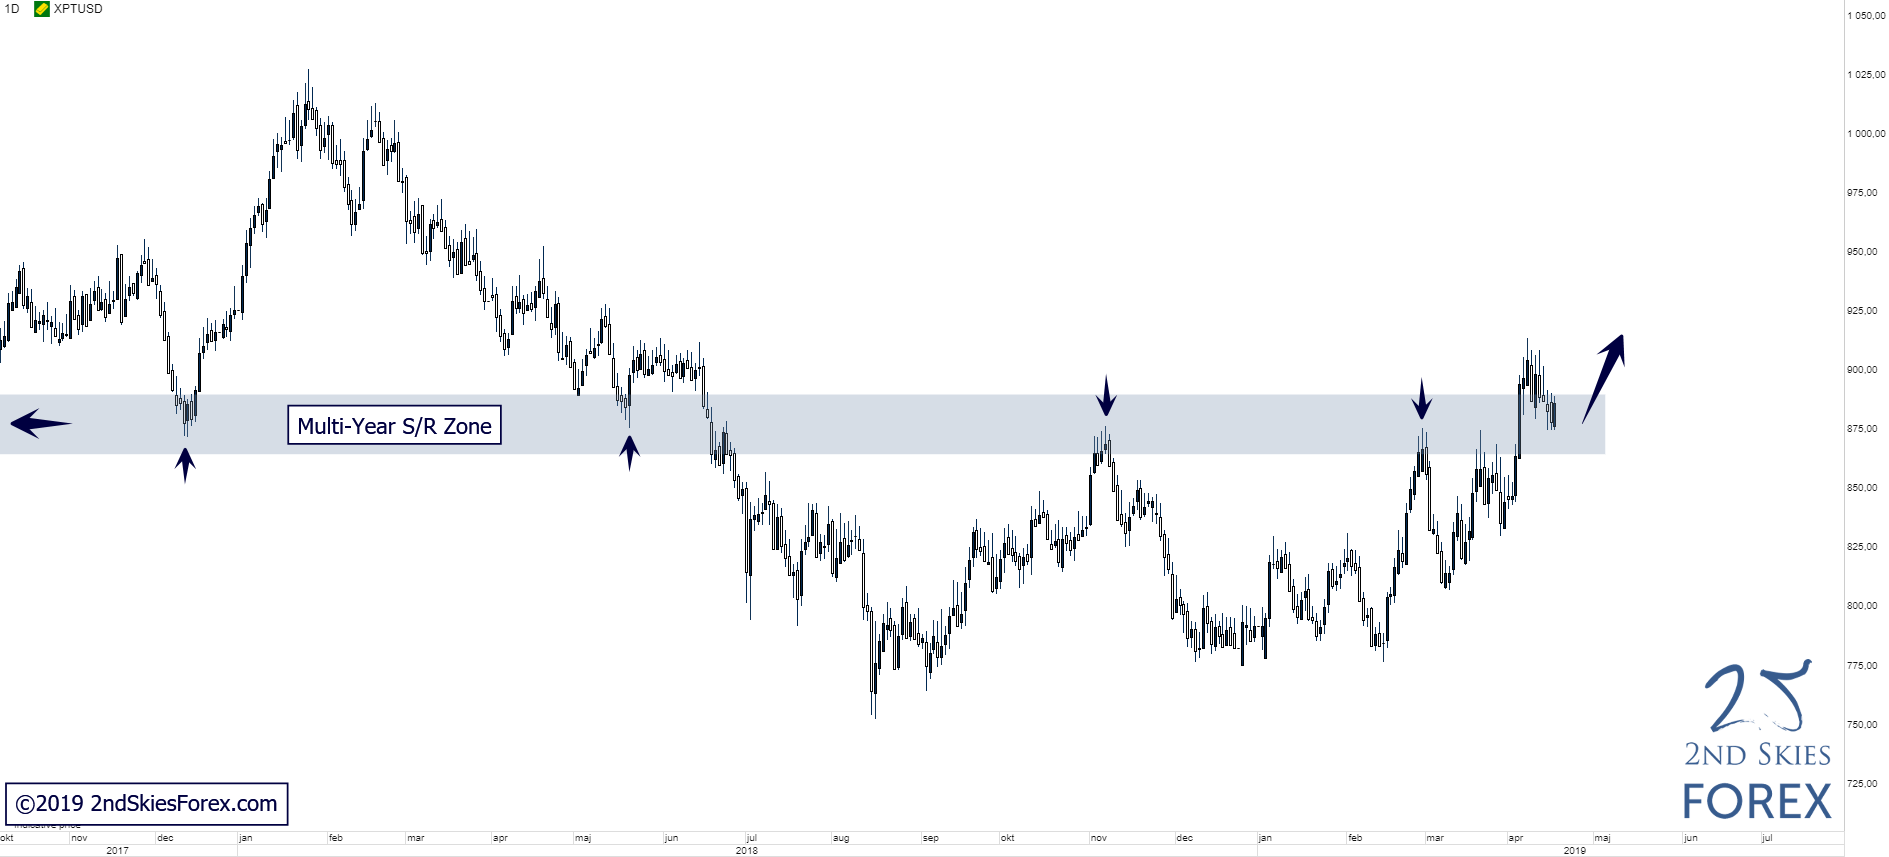
XPTUSD – Broken Above Multi-Year S/R Zone (Daily chart)

Price Action Context
After trading roughly 11 months below the multi-year S/R zone, bulls have now successfully pushed the price of this precious metal back above the key resistance, which is now being tested as support.
Trending Analysis
The current pullback should be of interest to bulls as it can offer potential buying opportunities in anticipation of a possible bullish continuation north.
Key Support & Resistance Zones
R: 1015 – 1043
S: 865 – 890
Visit our website at 2ndSkies for more price action content, free trading lessons, strategies and videos. Find out how we can help you to change the way you think, trade and perform.
Author

Chris Capre
2ndskiesforex
Chris Capre is a professional forex trader and mentor specialized in Price Action trading, and the Ichimoku Cloud.
More from Chris Capre


