|

XLP: Another dip offered another buying opportunity

In this technical blog, we will look at the past performance of 1 hour Elliott Wave Charts of XLP, which we presented to members at the elliottwave-forecast. In which, the rally from 03 March 2021 low unfolded as an impulse structure. And showed a higher high sequence favored more upside extension to take place. Therefore, we advised members not to sell the stock & buy the dips in 3, 7, or 11 swings at the blue box areas. We will explain the structure & forecast below:

XLP 1 Hour Elliott Wave Chart

Above is the 1hr Elliott wave chart of XLP from the 4/27/2021 update. In which, the rally to $70.47 high ended wave 3 of an impulse sequence coming from 3/03/2021 low. Down from there, the ETF made a pullback in wave 4 to correct the cycle from the 3/05/2021 low. The internals of that pullback unfolded as Elliott wave zigzag structure where wave ((a)) ended in 3 swings at $69.29 low. Wave ((b)) bounce ended at the $69.79 high. Wave ((c)) was expected to reach the blue box area at $68.61- $67.88 100%-161.8% Fibonacci extension area of ((a))-((b)). From there, buyers were expected to appear looking for further upside ideally or for a 3 wave bounce at least.

XLP 1 Hour Elliott Wave Chart

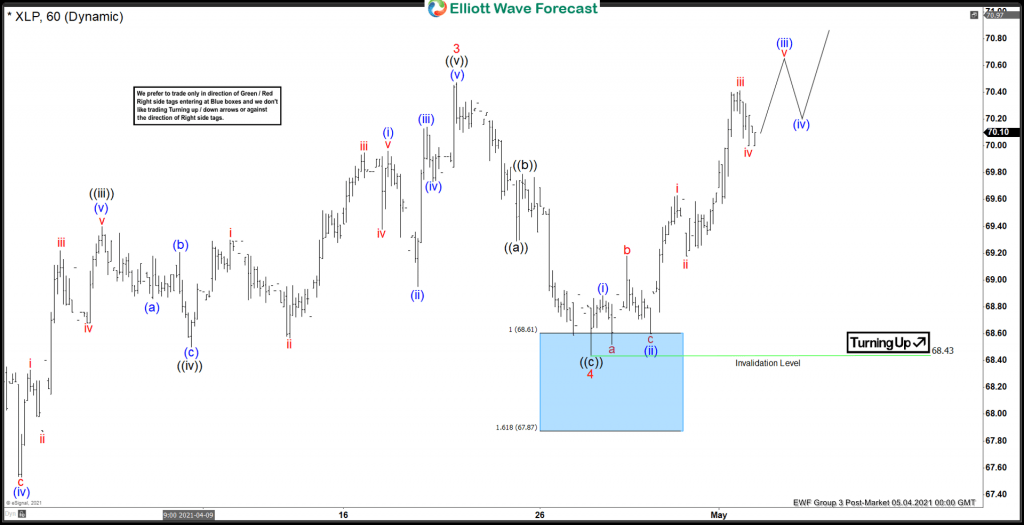
Here’s the latest 1hr Elliott wave chart of XLP from the 5/04/2021 Post-Market update. The ETF is showing a strong reaction higher taking place from the blue box area after ending the zigzag correction at $68.43 low. Allowed members to create a risk-free position shortly after taking the long positions at the blue box area.
 

Author

Elliott Wave Forecast Team

Elliott Wave Forecast Team

ElliottWave-Forecast.com

More from Elliott Wave Forecast Team
Share:

Editor's Picks

EUR/USD: US Dollar to remain pressured until uncertainty fog dissipates

Unimpressive European Central Bank left monetary policy unchanged for the fifth consecutive meeting. The United States first-tier employment and inflation data is scheduled for the second week of February. EUR/USD battles to remain afloat above 1.1800, sellers moving to the sidelines.

GBP/USD reclaims 1.3600 and above

GBP/USD reverses two straight days of losses, surpassing the key 1.3600 yardstick on Friday. Cable’s rebound comes as the Greenback slips away from two-week highs in response to some profit-taking mood and speculation of Fed rate cuts. In addition, hawkish comments from the BoE’s Pill are also collaborating with the quid’s improvement.

Gold holds gains near $5,000 as China's gold buying drives demand

Gold price clings to the latest uptick near $5,000 in Asian trading on Monday. The precious metal holds its recovery amid a weaker US Dollar and rising demand from the Chinese central bank. The delayed release of the US employment report for January will be in the spotlight later this week.

Week ahead: US NFP and CPI data to shake Fed cut bets, Japan election looms

US NFP and CPI data awaited after Warsh’s nomination as Fed chief. Yen traders lock gaze on Sunday’s snap election. UK and Eurozone Q4 GDP data also on the agenda. China CPI and PPI could reveal more weakness in domestic demand.

Three scenarios for Japanese Yen ahead of snap election

The latest polls point to a dominant win for the ruling bloc at the upcoming Japanese snap election. The larger Sanae Takaichi’s mandate, the more investors fear faster implementation of tax cuts and spending plans. 

XRP rally extends as modest ETF inflows support recovery

Ripple is accelerating its recovery, trading above $1.36 at the time of writing on Friday, as investors adjust their positions following a turbulent week in the broader crypto market. The remittance token is up over 21% from its intraday low of $1.12.