XAU/USD: Triangle breakdown points to wave ((C)) decline toward 100% extension of wave ((A))

Gold slumps as safe-haven demand wanes
Gold prices have experienced a significant decline, dropping over 7% from the all-time high of $3,500 reached in April. As of May 1, 2025, spot gold is trading around $3,232 per ounce, marking a two-week low. This downturn is attributed to several factors:
- Easing Trade Tensions: Recent developments suggest a de-escalation in U.S.-China trade tensions. President Trump's announcement of potential trade deals with countries like India, South Korea, and Japan has reduced geopolitical uncertainties, diminishing gold's appeal as a safe-haven asset .
- Stronger U.S. Dollar: The U.S. dollar index has strengthened, making gold more expensive for holders of other currencies and thereby reducing demand .
- Profit-Taking: After a substantial rally, investors are engaging in profit-taking, contributing to the price decline.
Gold fails to hold post-triangle – Wave ((C)) now in play
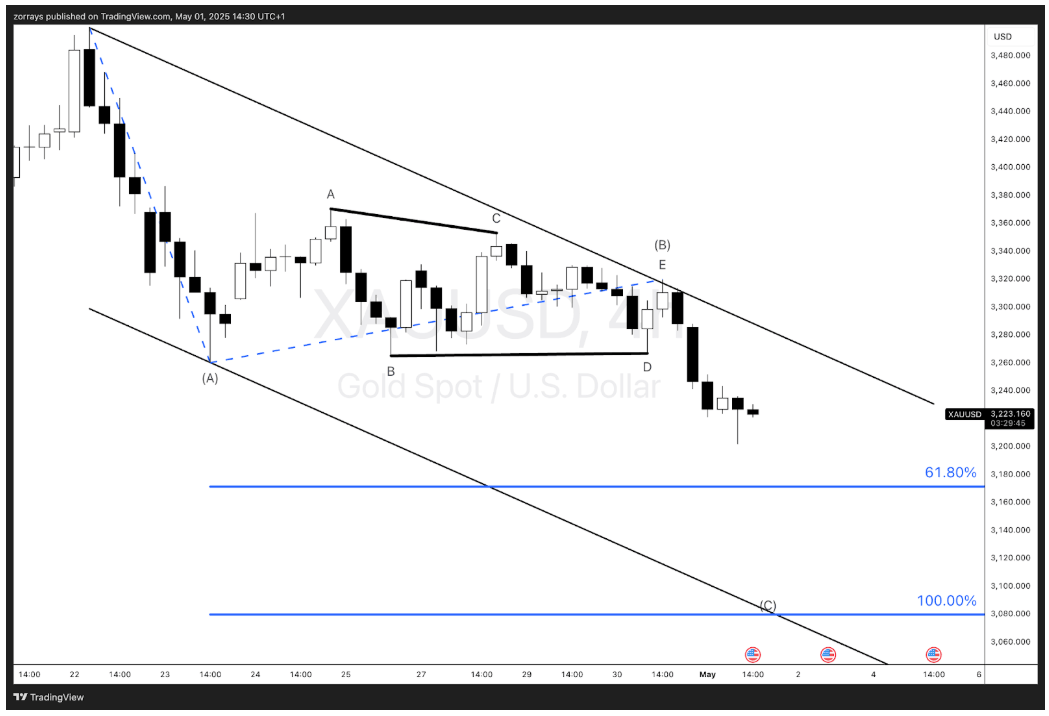
Gold (XAU/USD) has finally resolved a multi-session triangle structure to the downside, confirming what appears to be the start of wave ((C)) within a larger corrective sequence. Price is currently trading around $3,226, and action post-breakout has been impulsive, in line with expectations for a third leg decline.
Triangle (B) confirmed, breakdown validates bearish bias
The contracting triangle, which formed in what we’ve labelled as wave (B), completed its five-wave internal structure (A–B–C–D–E) and broke cleanly through the lower trendline. This action conforms to typical Elliott Wave triangle behavior—especially when occurring as wave (B) within a simple A–B–C correction.
The failure to reclaim the upper trendline post-E validates the count. Price action following the breakdown has stayed well within the bounds of the descending channel, suggesting containment and directional bias remain intact.
Wave ((C)) progression toward 100% equality of ((A))
We now anticipate further follow-through toward the 100% extension of wave ((A)), which aligns closely with the $3,100 area—a level that coincides with the lower bound of the channel. Given the proportionality typically observed in corrective sequences, this equality target becomes a logical pivot zone to monitor.
From a structural perspective, wave ((C)) appears impulsive, with subdivisions suggesting a possible acceleration as the move unfolds. If this sequence continues to develop cleanly, wave ((C)) should unfold in five waves and complete near the projected target. The 61.8% retracement area near $3,180 is noted but given the post-triangle momentum, that may act as temporary support only.
Final thoughts
The clean post-triangle decline offers clarity on the near-term path for gold. With wave ((C)) unfolding, we’re tracking an impulsive move targeting the 100% extension of wave ((A)) at the channel lows. So long as price remains beneath the post-triangle breakdown point (~$3,300–$3,310), the path of least resistance remains lower.
Any break above the prior wave E high would challenge the structure, but at this stage, the pattern is holding textbook formation. We continue to monitor for subwave development within ((C)) and refine the lower target zone as price progresses.
Author

Zorrays Junaid
Alchemy Markets
Zorrays Junaid has extensive combined experience in the financial markets as a portfolio manager and trading coach. More recently, he is an Analyst with Alchemy Markets, and has contributed to DailyFX and Elliott Wave Forecast in the past.


