XAU/USD Pullback Before New Bullish Break and Uptrend

Gold – XAU/USD
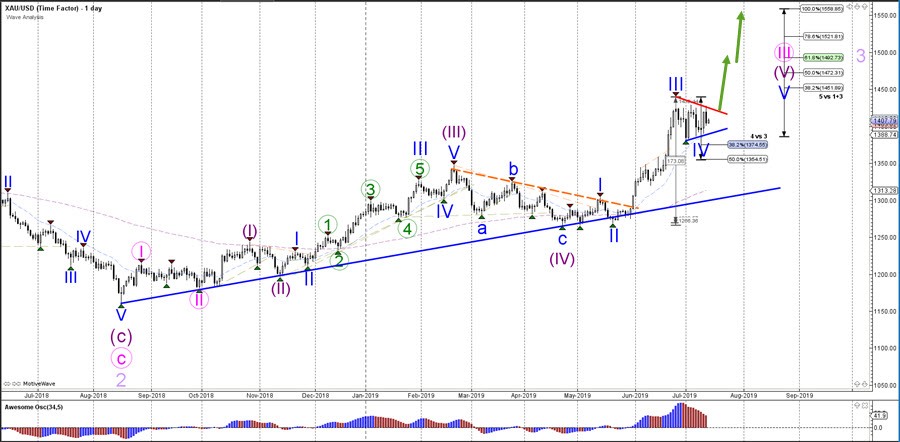
Daily
The XAU/USD triangle chart pattern is respecting the shallow Fibonacci retracement levels of wave 4 vs 3 which is typical behavior for a wave 4 (blue) pattern. A bullish breakout above the resistance trend line (red) would confirm the uptrend continuation towards the Fibonacci targets of waves 5 whereas an unexpected break below the 50% Fib would indicate that the bullish momentum is losing its steam. At the moment a new bull run on XAU/USD is becoming increasingly more likely.
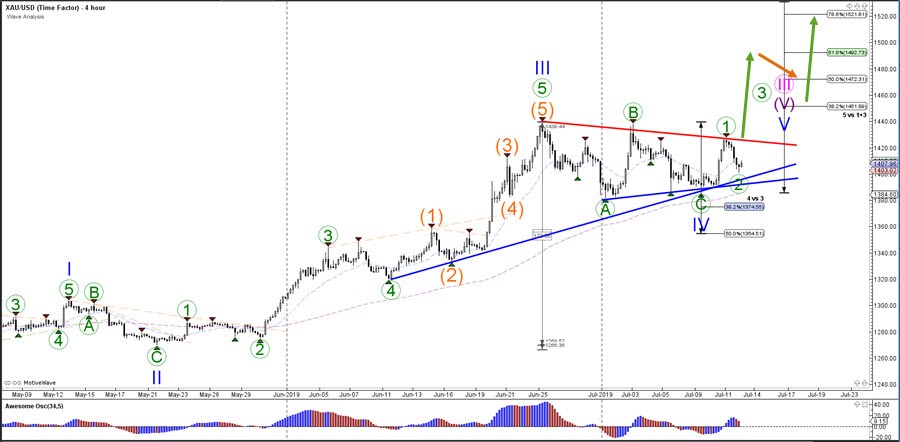
4 hour
The XAU/USD seems to have completed a bearish ABC pattern (green) within the wave 4 (blue) pattern. The recent bullish momentum is probably indicating the restart of the uptrend via wave 1 (green). The current pullback is therefore a wave 2 (green) as long as price stays do not break below the bottom of wave 1, which would invalidate the wave 1-2 pattern (green). The same idea is valid for this chart as well: a bullish breakout could indicate the start of an uptrend via a potential wave 3 (green) pattern.
The analysis has been done with the CAMMACD.MTF template.
For more daily technical and wave analysis and updates, sign-up up to our ecs.LIVE channel.
Author

Chris Svorcik
Elite CurrenSea
Experience Chris Svorcik has co-founded Elite CurrenSea in 2014 together with Nenad Kerkez, aka Tarantula FX. Chris is a technical analyst, wave analyst, trader, writer, educator, webinar speaker, and seminar speaker of the financial markets.


