XAG/USD Elliott Wave technical analysis [Video]
![XAG/USD Elliott Wave technical analysis [Video]](https://editorial.fxstreet.com/images/Markets/Commodities/Metals/Silver/silver-coin-and-bullion-bar-21936522_XtraLarge.jpg)
Silver Elliott Wave analysis
In September, Silver has given back much of the gains it made in August. However, despite the current corrective pullback, the overall bullish outlook remains intact in the short term, especially once this correction is confirmed to be complete. This analysis will explore where and when the next phase of the August rally is likely to resume.
Long-term chart analysis
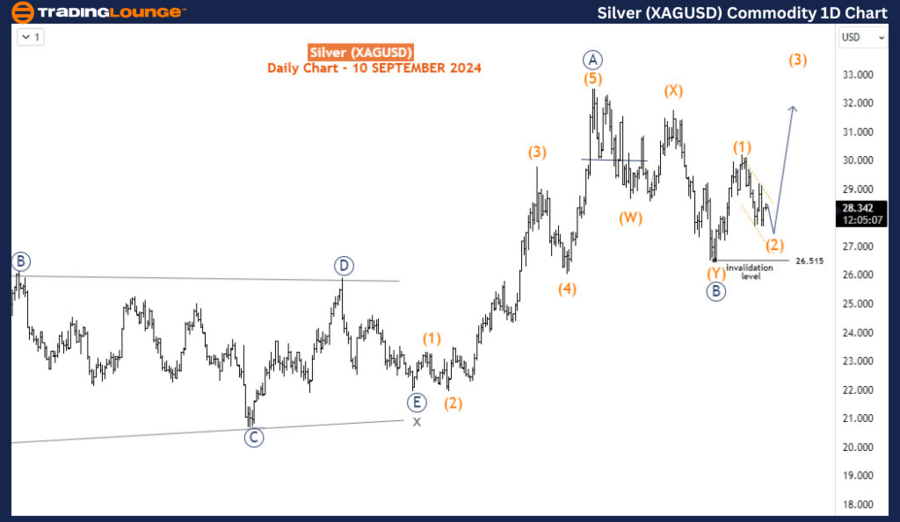
Silver has been in a strong bullish sequence since October 2023. Although the commodity experienced a substantial pullback during December 2023 and January 2024, the underlying strength of the bullish trend has persisted. Silver rallied strongly from January 2024, reaching a fresh high for the year in May. After that high, another significant pullback took place, but the recovery seems to be back on track, provided the current dip from late August does not break the key support level at $26.515. As long as prices remain above this level, the broader bullish structure remains intact.
Daily chart analysis
On the daily chart, the rally from January 2024 completed an impulsive wave structure, labeled as wave A (circled) of the primary degree. Following this, the pullback from the May 2024 high completed a double zigzag corrective pattern, which ended in August 2024. The key level here is $26.515, from which we expect Silver to embark on a new impulsive rally that will form wave C (circled) of the primary degree. According to technical projections, wave C (circled) has the potential to push prices up to $37.15 in the coming weeks or months.
For this bullish impulse to unfold, the current corrective dip—labeled as wave (2) of C (circled)—must remain above $26.515. A breach of this level would invalidate the current wave structure and suggest that wave B (circled) is extending lower, which would delay the anticipated upward rally.
H4 chart analysis
The H4 chart offers a closer view of the ongoing corrective wave (2). This wave appears to be unfolding in a double zigzag pattern, with waves W and X already completed. The market is now progressing within wave Y of (2), with the first sub-wave of Y having finished on September 6. The current upward bounce is part of the second sub-wave, but another decline is expected as the third sub-wave of Y completes the structure.
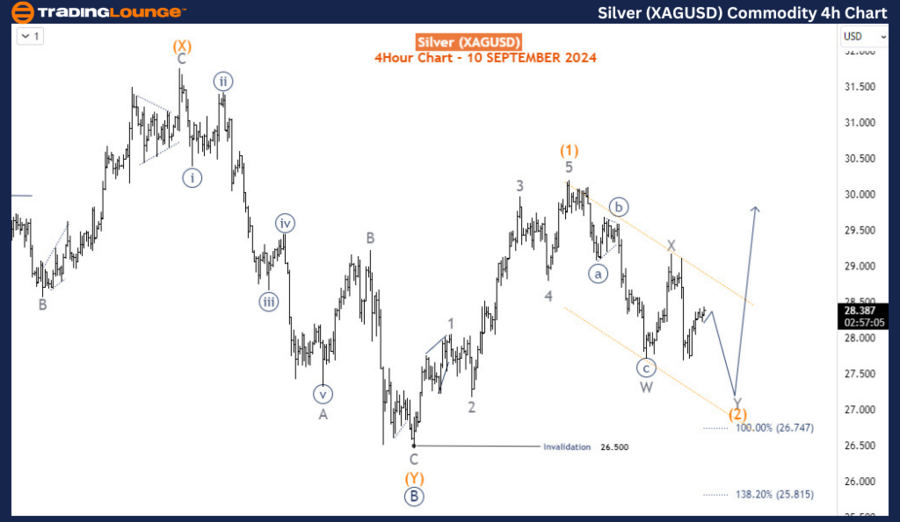
In the short term, the downside is favored, but any further decline is likely to be limited above the critical $26.515 level. Once wave Y of (2) concludes, Silver should resume its upward trajectory in wave (3) of C (circled), marking the next stage of the bullish rally. Traders should be cautious during this corrective phase but remain optimistic about the long-term upside, as the larger trend continues to favor buyers.
Conclusion
While Silver is experiencing a short-term correction, the broader Elliott Wave structure suggests that the bullish trend will resume once this pullback is completed. The key support level to watch is $26.515—if it holds, Silver is expected to rally toward $37.15 in the coming weeks or months. Therefore, despite the current short-term downside, the long-term outlook remains bullish, with further gains likely ahead.
Technical analyst: Sanmi Adeagbo.
Silver Elliott Wave analysis [Video]
Author

Peter Mathers
TradingLounge
Peter Mathers started actively trading in 1982. He began his career at Hoei and Shoin, a Japanese futures trading company.


