WTI Elliott Wave technical analysis [Video]
![WTI Elliott Wave technical analysis [Video]](https://editorial.fxstreet.com/images/Markets/Commodities/Energy/Oil/oil-industry-6501390_XtraLarge.jpg)
WTI Elliott Wave analysis
Crude oil prices remain sideways below $73 as momentum shrinks. A bearish breakout is more likely toward $60, However, the commodity will have to breach the $64-62 price zone which may offer support at some point.
WTI daily chart analysis
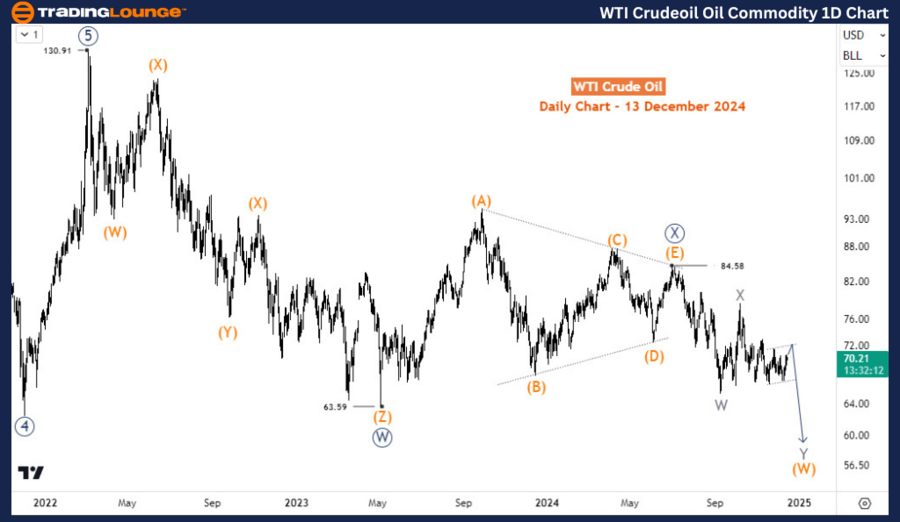
In the long term, the price is still correcting the impulse rally between April 2020 and March 2022 which saw the commodity reach almost $131. Thus, the decline from March 2022 is evolving into a double-zigzag corrective structure. Wave ((W)) finished at $63.5 in May 2023 with a triple zigzag structure before a sideways triangle structure ended wave ((X)) at $84.5 in July 2024. Thus, the decline from $84.5 (July 2024) is expected to be for wave ((Y)). However, it’s still in the early stage. Price completed wave W of (W) of ((Y)) in September 2024 and then the corresponding wave Y in October 2024. Price is now in wave Y of (W) which is incomplete and has the potential to reach $61-57.
Four-hour chart analysis
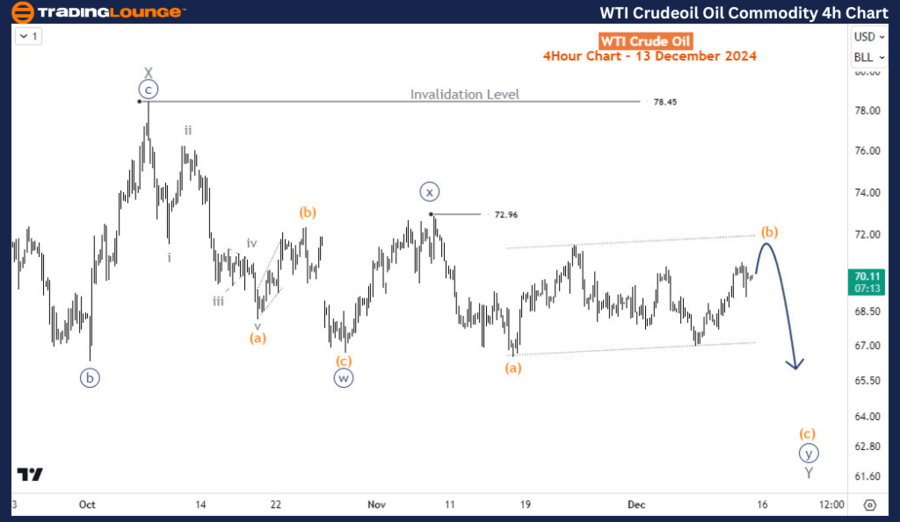
On the H4 chart, the price is currently in wave (b) of ((y)) of Y if 72.96 continues to hold. However, a breach of 72.76 will make us consider a new potential top for ((x)) if the price remains below the 78.45 invalidation level. For as much as the price stays below 78.45, the potential for more downside is higher than the upside.
WTI Elliott Wave technical analysis [Video]
Author

Peter Mathers
TradingLounge
Peter Mathers started actively trading in 1982. He began his career at Hoei and Shoin, a Japanese futures trading company.


