WTI and $CAD – Watch the correlation [Video]
![WTI and $CAD – Watch the correlation [Video]](https://editorial.fxsstatic.com/images/i/West-Texas-Intermediate_3.png)
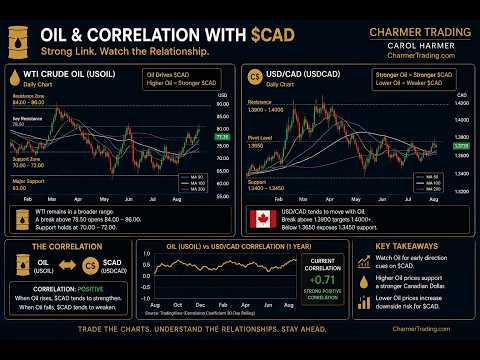
WTI made the bounce off the 200-week M/A two weeks ago, and we’ve seen a decent recovery from those lower levels, despite closing below the 200-day M/A for two consecutive days.
But trading Oil without looking at $CAD means you’re only looking at half the picture.
These two markets correlate very closely. As Oil rises, the Canadian Dollar tends to strengthen — which means USD/CAD tends to fall.
On USD/CAD, there are two important levels to watch this week:
- 200-day M/A — 1.3852.
- 200-week M/A — 1.3734.
Both could prove significant.
Meanwhile, WTI has formed a small bullish flag on the Daily chart, which gives a broader technical target around 95.50.
Before we start looking that far ahead, though, the initial upside levels are:
- 86.14/86.59.
I would expect some profit-taking around this area, but I’ll still be keeping 95.50 firmly on the radar further down the line.
Today’s WTI Pivot Point: 82.03.
Yes, we’re in Summer markets — but Oil can still move.
For me, the overall technical picture remains:
Buy Oil on dips.
Sell USD/CAD — if not here, then on rallies/pullbacks or following a close below the 200-day M/A.
Watch the charts. But just as importantly, watch the relationships between the markets.
This is not to be construed as investment advice.
Author

Carol Harmer
Charmer Trading
Carol Harmer has over 39 years experience of analysing and trading the world's markets and is undoubtedly one of the most respected technical trader in the world today.
















