Why the Fed replaced the Treasury buyers who left
The most discussed piece of central bank plumbing of the past month is a facility that has never been used.
When Japan moved to defend the Yen, the arrangement that drew the attention was the Federal Reserve's (Fed) repo facility for foreign monetary authorities, which lets an approved foreign central bank raise dollars by temporarily handing Treasuries to the Fed rather than selling them into the market. The logic was elegant. Japan gets dollars, the Treasury market avoids a forced seller, and American long rates are spared. Coverage treated it as the mechanism that made the intervention work.
The weekly Federal Reserve balance sheet release shows the foreign official repo line at zero. Not a small number. Zero, unchanged on the week and unchanged on the year, and reportedly unused for eight consecutive weeks, with the last drawing of any size around $3 billion in February.
The facility everyone credited was never opened. Meanwhile, the Fed's balance sheet grew by $116.340 billion over the past year, and every dollar of that growth and more went into Treasury bills. What the balance sheet is absorbing is not Japan. It is the United States Treasury.
The backstop that has never been drawn
Start with what the release actually shows, because the direction of the flows is the opposite of the story.
Foreign official repurchase agreements with the Fed stand at zero. The facility running the other way, where foreign central banks park surplus dollars overnight rather than borrow them, holds $357.392 billion, up $1.820 billion on the year. Central bank liquidity swaps, the other channel through which the Fed lends dollars abroad, total $132 million, which in a balance sheet of $6.760 trillion is a rounding error.
Foreign monetary authorities are not drawing dollars from the Federal Reserve. They are net lenders to it, at scale, and have been for the whole period.
That does not mean the backstop is worthless. A credible commitment can work precisely by never being tested, because its existence removes a trade from the market. Anyone positioned for the Japanese authorities to be forced sellers of Treasuries had to reckon with the possibility that they would not have to sell at all, and that alone changes the calculation without a single dollar changing hands.
But it does mean something important for anyone pricing the arrangement. The capacity, the terms, the political durability and the size at which the facility would function in genuine stress are all entirely untested. The market has priced a promise. Nobody has seen the promise honoured.
The thing it was meant to prevent happened anyway
Here is the part that should give the comfortable reading pause.
The stated rationale for the arrangement was to avoid a scenario in which Japan liquidated Treasuries to fund a solo intervention, pushing American long yields higher. Set that against the custody data in the same release.
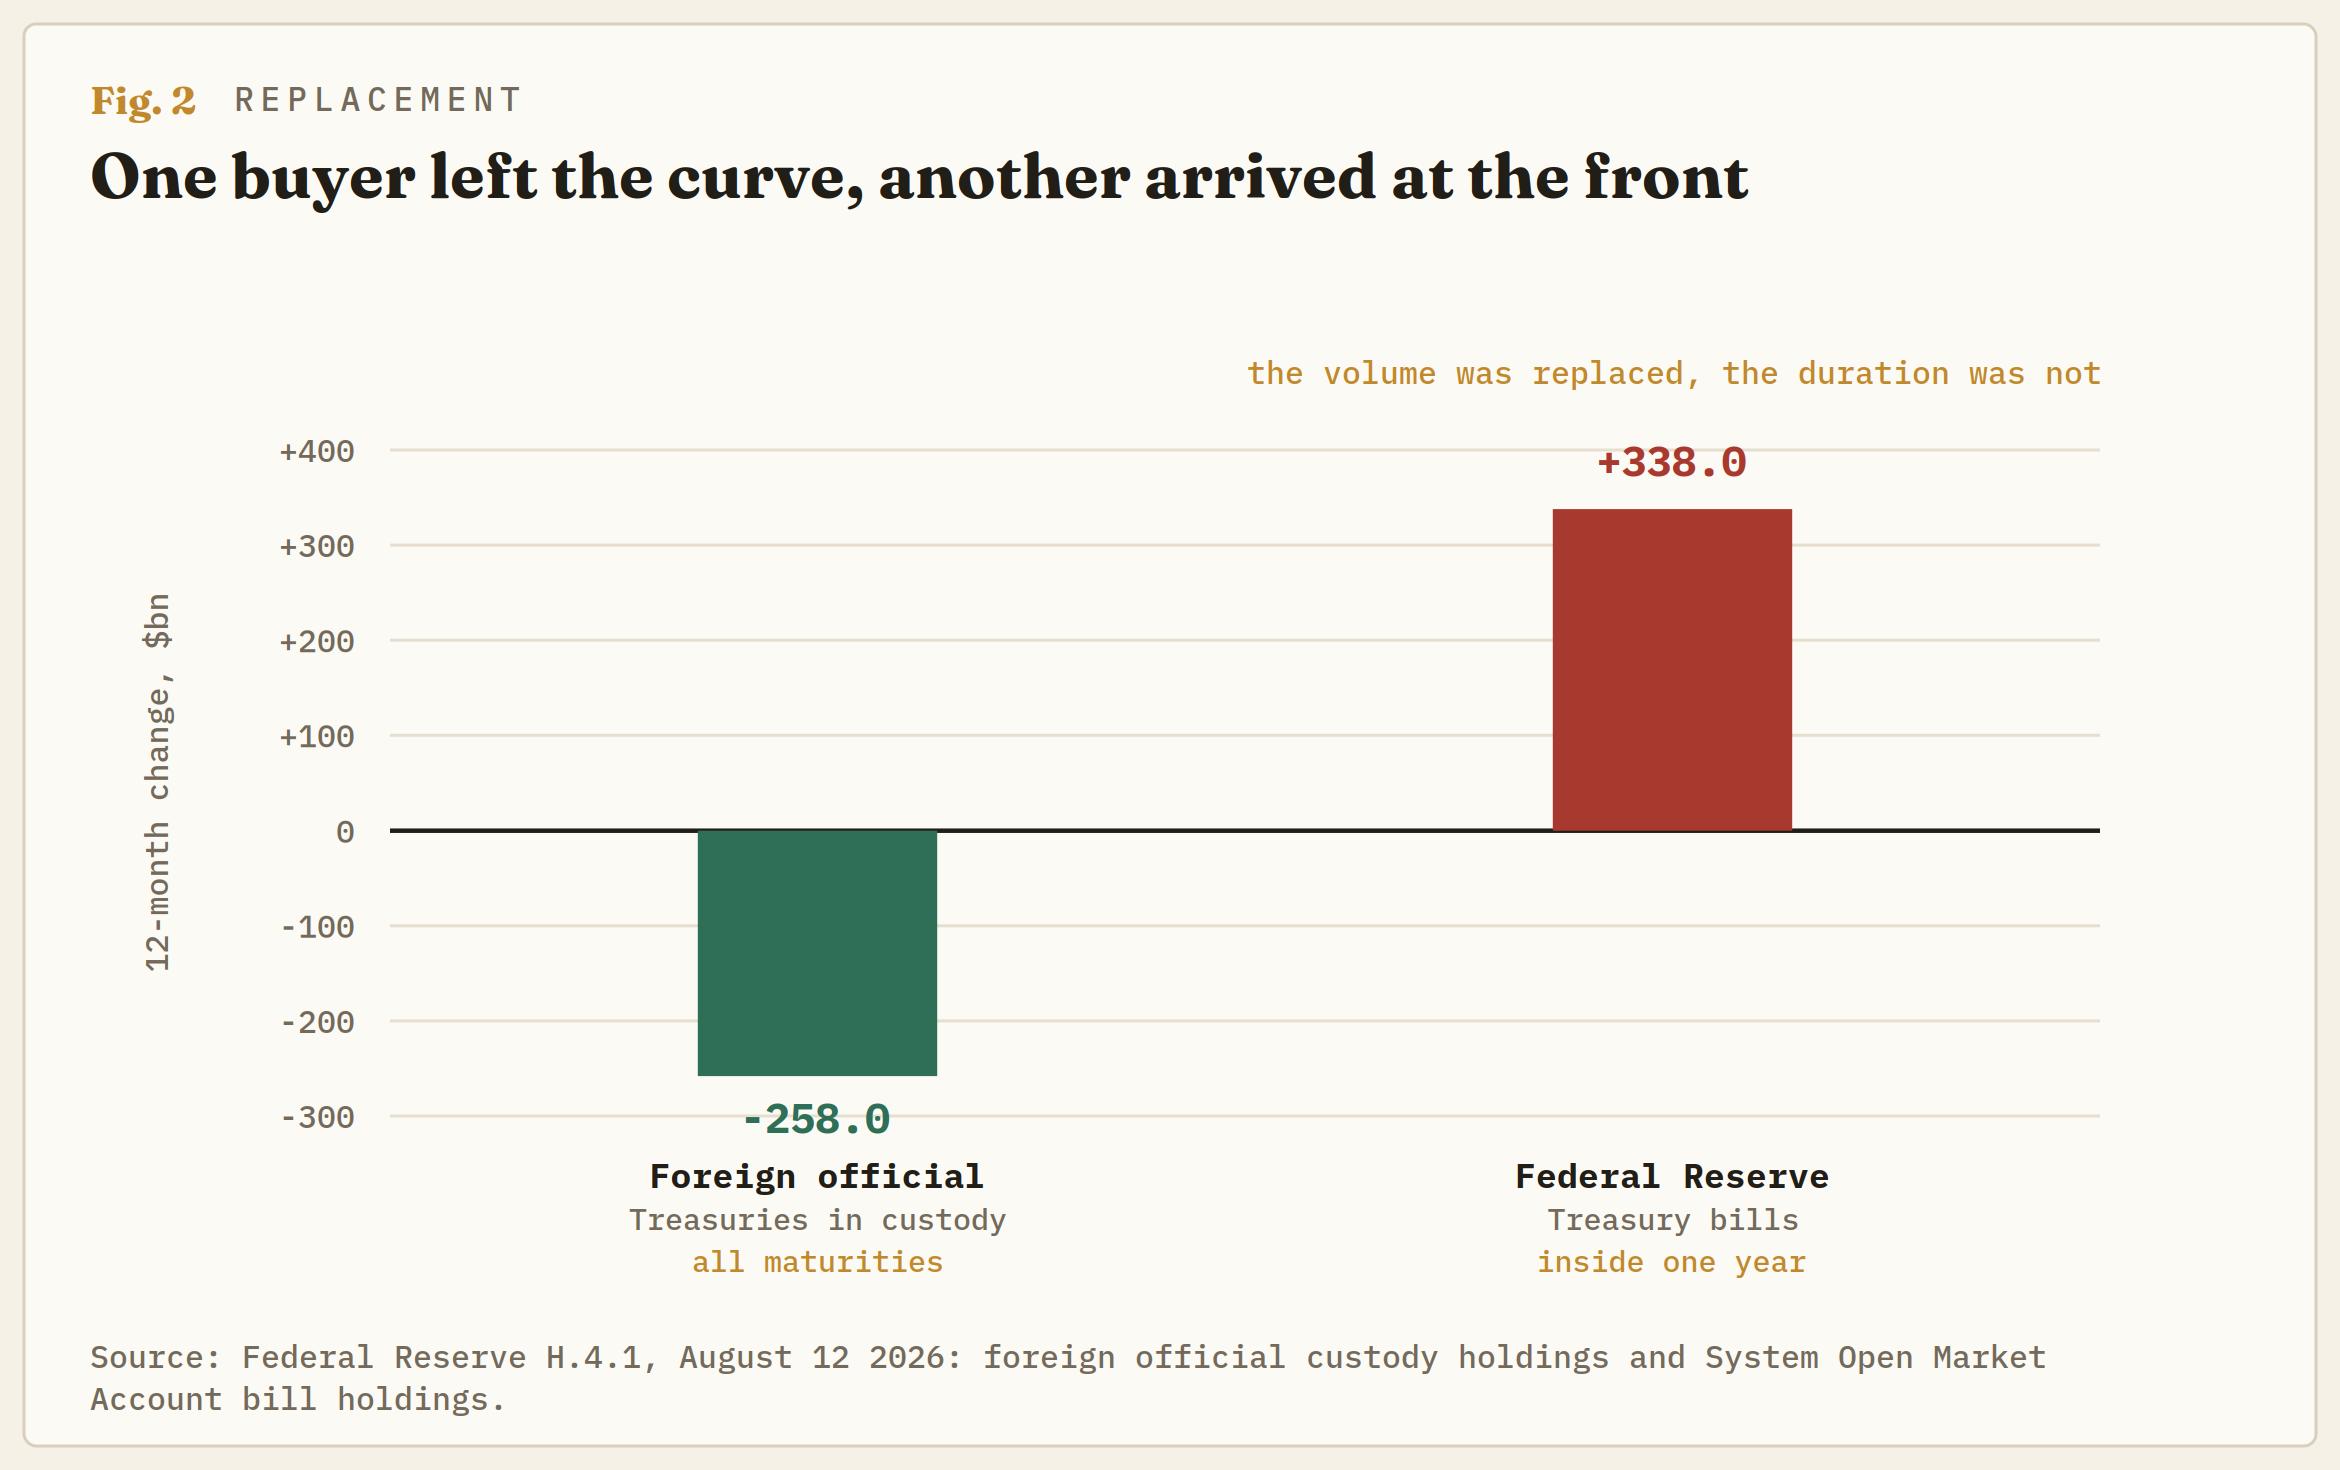
Securities held in custody at the Fed for foreign official and international accounts total $2.888 trillion, down $316.060 billion over the year. Marketable US Treasuries within that figure stand at $2.609 trillion, down $257.964 billion.
Foreign official holders have reduced their Treasury holdings at the Fed by roughly a quarter of a trillion dollars in twelve months. The facility designed to prevent exactly that was never touched. The selling happened regardless, through ordinary channels, at a pace no single intervention would have produced.
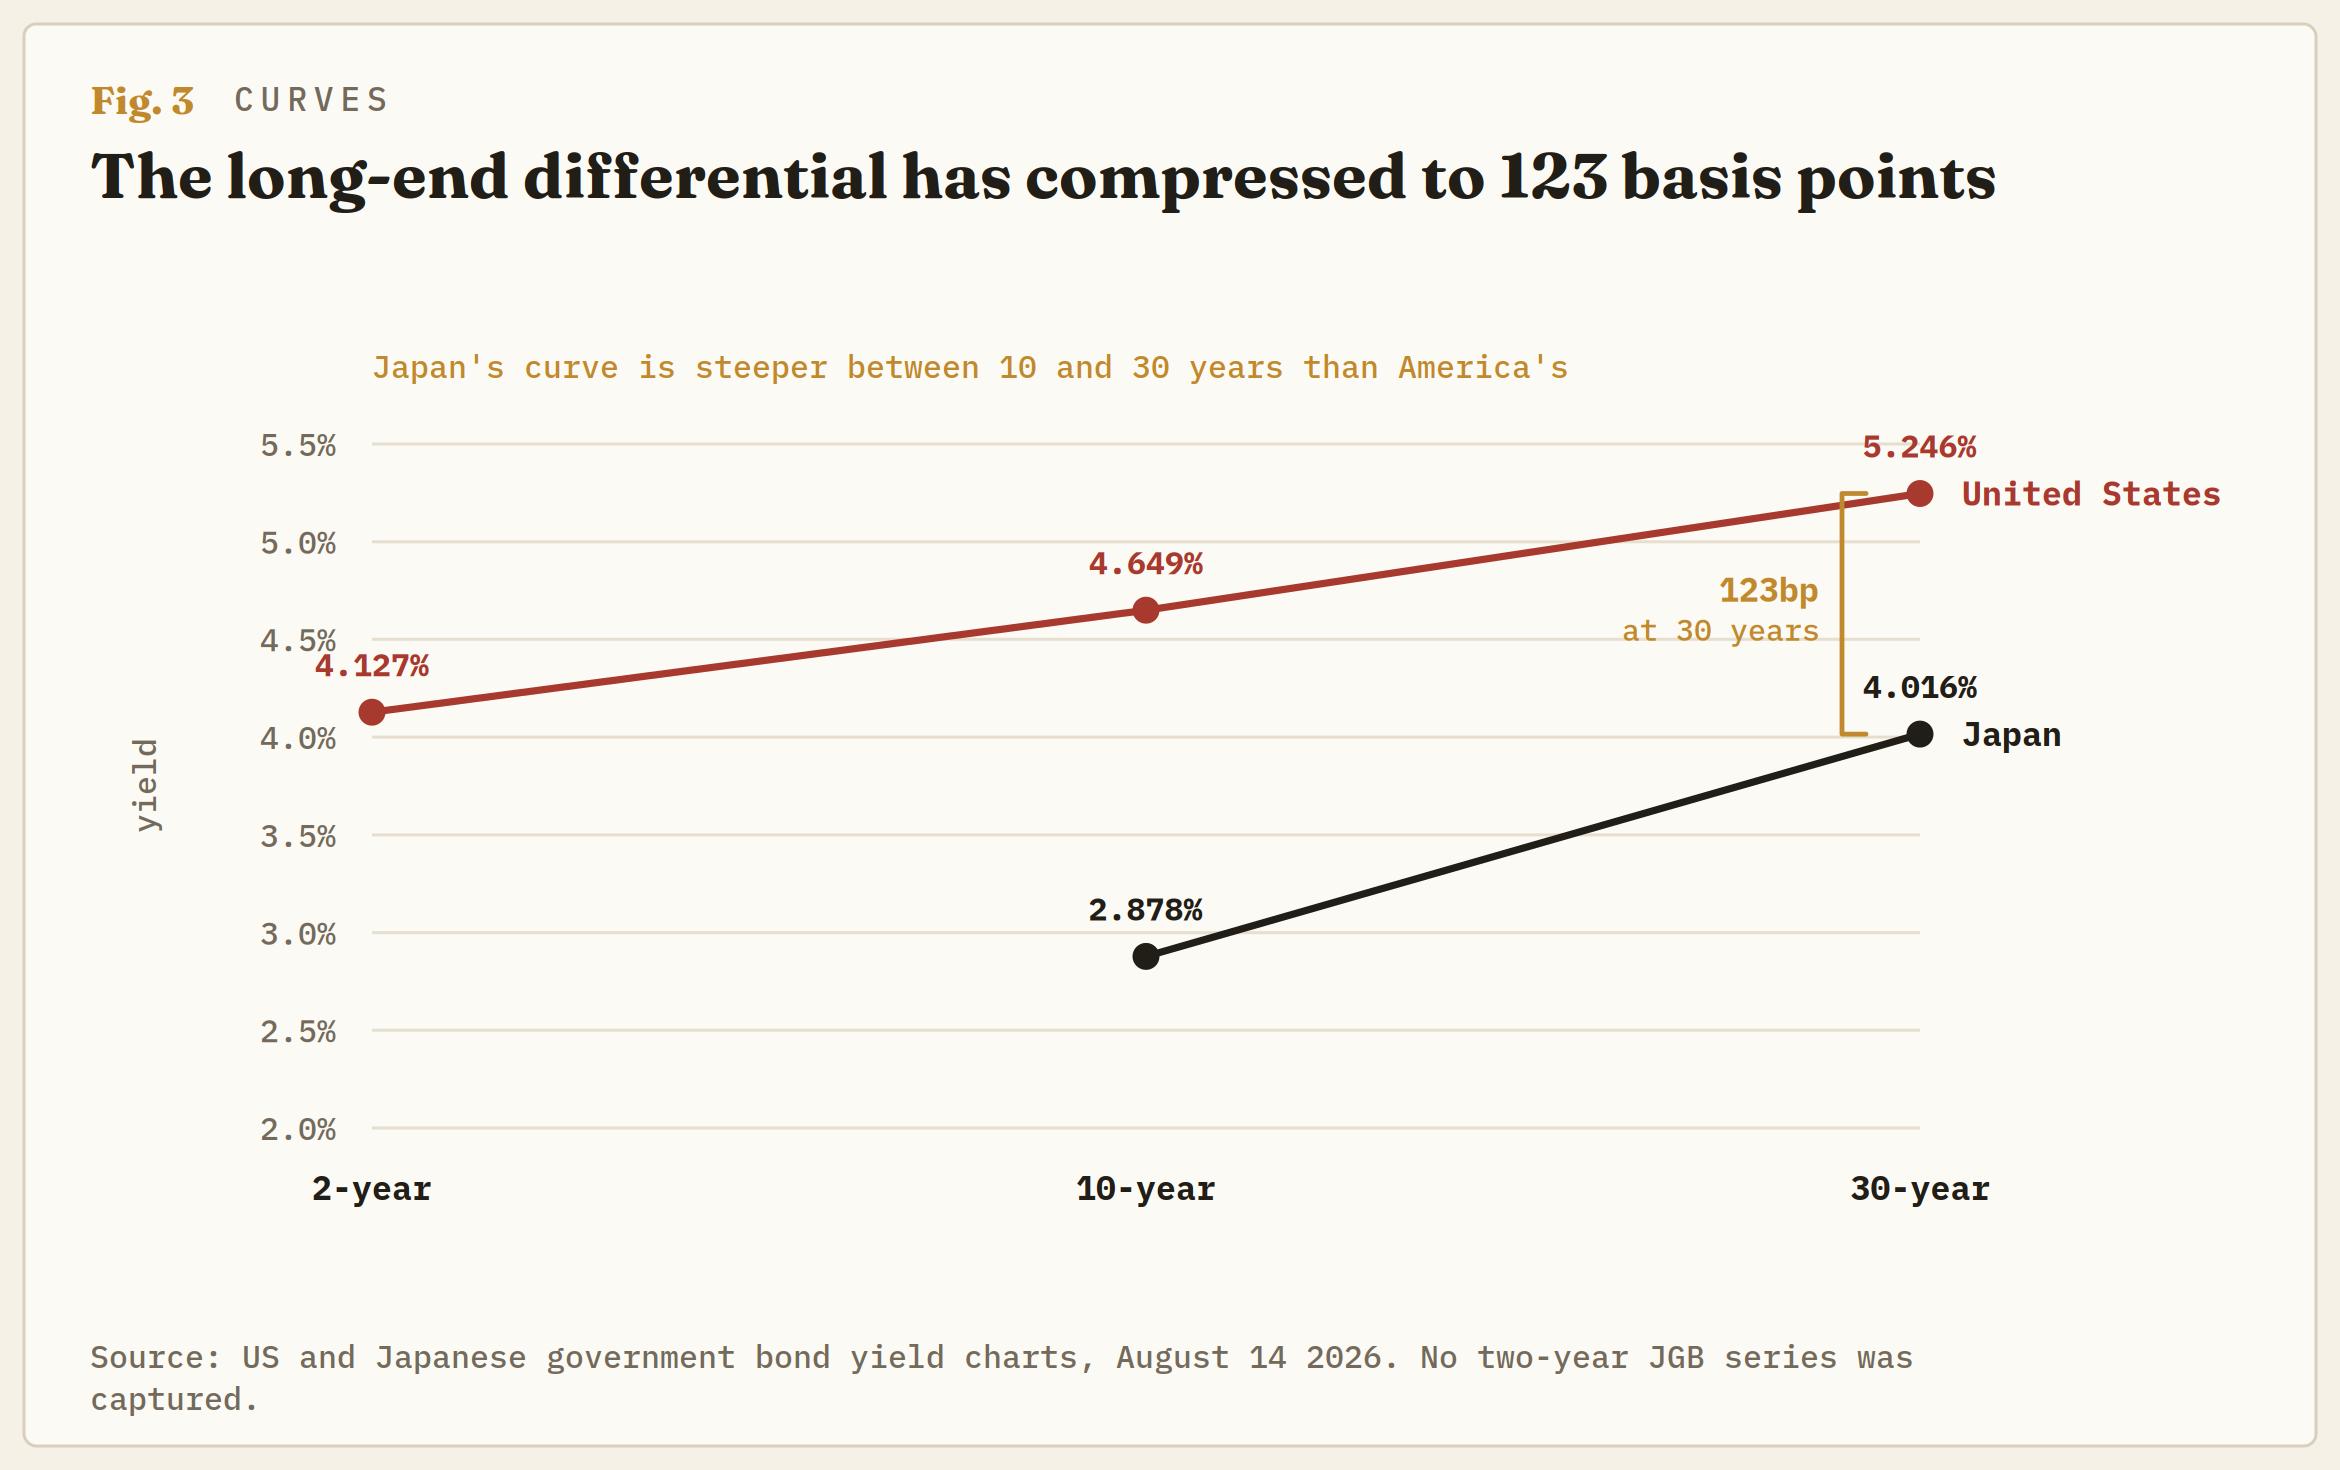
And the long end shows it. The thirty-year yield trades at 5.246%, within four basis points of the highest print in the window and roughly 90 basis points above where it sat at the start of last year. The ten-year is at 4.649%. The two-year, by contrast, is at 4.127%, some 30 basis points below its own high.
The front end has rallied. The long end has not. That divergence is the single most informative thing on the American curve right now, and the balance sheet explains it.
What the balance sheet is actually absorbing
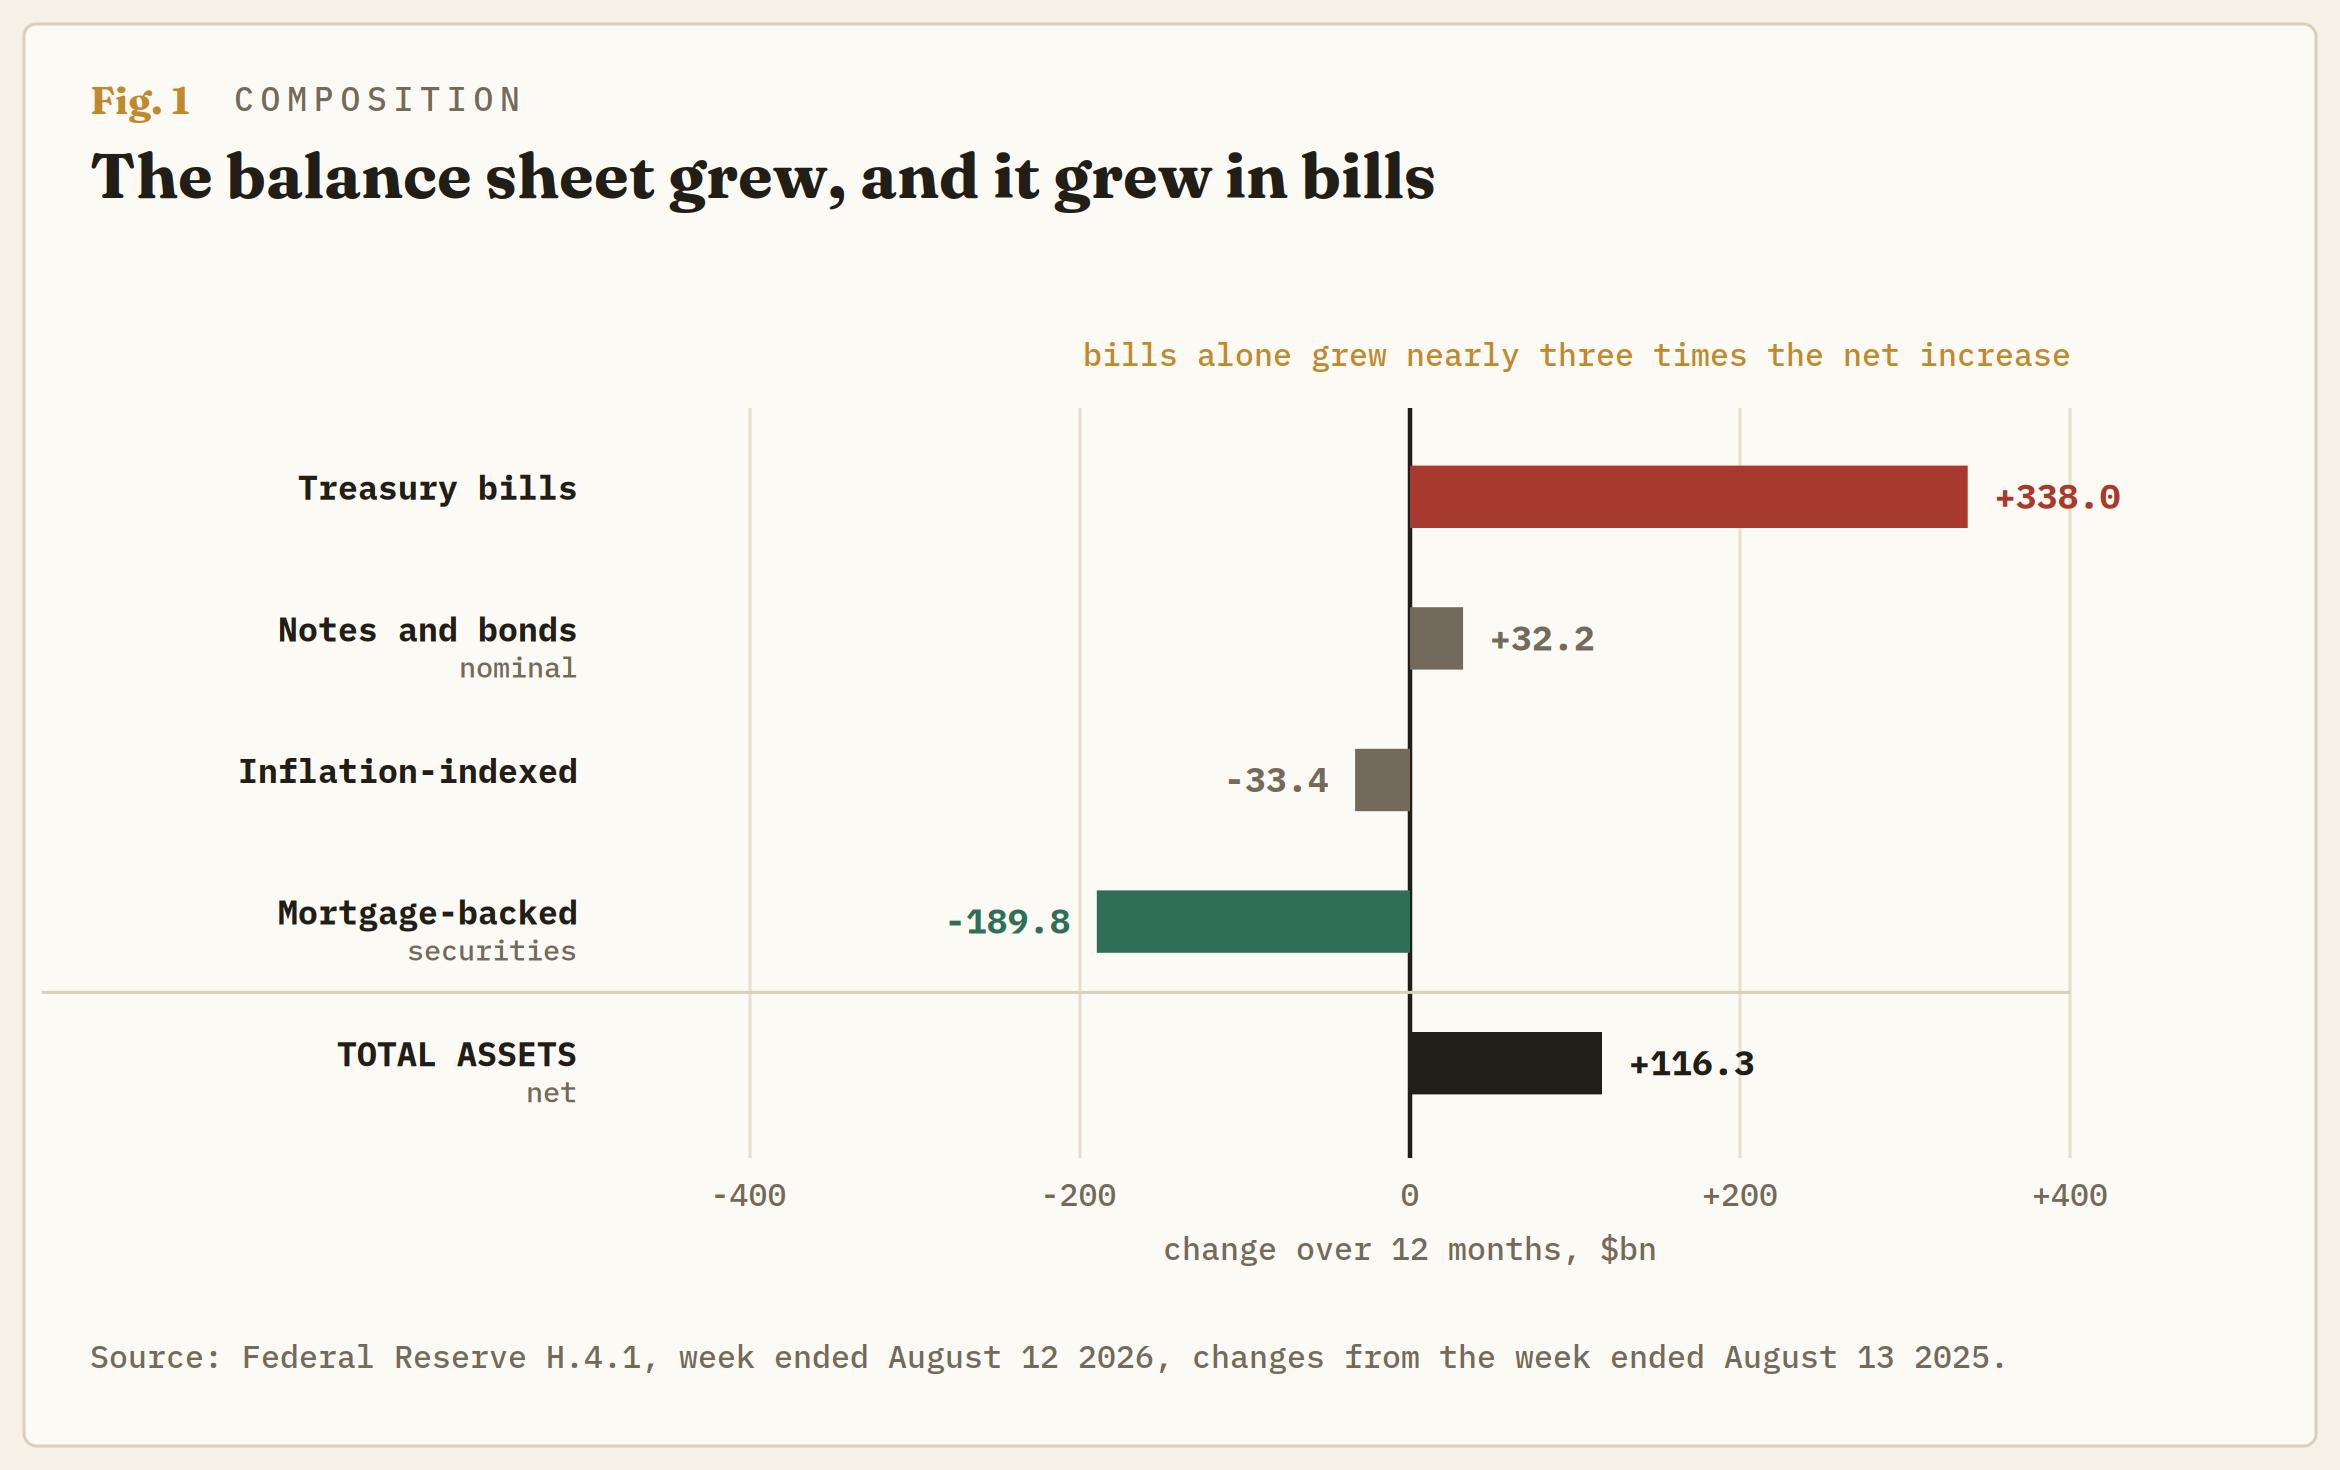
Total Federal Reserve assets stand at $6.760 trillion, up $116.340 billion on the year. A balance sheet that a hawkish Chair has reportedly discussed shrinking as a tightening instrument has instead grown. The composition is where it becomes interesting.
Treasury bill holdings stand at $533.509 billion, up $338.016 billion over the year. That is close to a tripling in twelve months. Over the same period, nominal notes and bonds rose just $32.151 billion, inflation-indexed holdings fell $33.351 billion, and mortgage-backed securities ran off by $189.751 billion.
So the Fed shed $190 billion of mortgages, left its coupon holdings essentially flat, and bought $338 billion of bills. The maturity table confirms the pattern is still running. In the most recent week, holdings maturing in sixteen to ninety days rose $5.120 billion and those maturing in ninety-one days to a year rose $11.835 billion, while every bucket beyond one year was flat or marginally lower.
Put the two datasets together and the picture is unambiguous. Foreign official holders sold roughly $258 billion of Treasuries across the maturity spectrum. The Federal Reserve bought $338 billion of Treasuries concentrated almost entirely inside one year.
The Fed replaced the volume. It did not replace the duration. The long end lost a large, price-insensitive, buy-and-hold holder and gained nothing in its place. That is why the thirty-year sits at its highs while the two-year sits thirty basis points below its own, and it is a far more durable explanation of the curve than any week's inflation print.
The reserves went to the Treasury, not the banks
One more line deserves attention, because it explains why a growing balance sheet has not felt like easing.
Reserve balances held by depository institutions stand at $2.948 trillion, down $375.991 billion over the year. The balance sheet expanded by $116 billion and bank reserves fell by $376 billion at the same time. Those two facts are reconciled by a single liability line: the Treasury General Account, the government's own cash balance at the Fed, which stands at $959.405 billion and is up $443.936 billion on the year.
The Treasury has drained close to half a trillion dollars of reserves out of the banking system and into its own account. The Fed's bill buying has partially offset it. The net effect is a system with materially fewer reserves than a year ago despite a larger central bank balance sheet, which is a peculiar place to be arguing about whether to tighten further.
Why Japan's long end is the actual threat
The Yen story is real, but the mechanism is not the one being discussed.
Japanese government bond (JGB) yields have moved to levels not seen in a generation. The thirty-year JGB trades at 4.016%, having ranged from 2.202% across the window, a rise of roughly 180 basis points. The ten-year sits at 2.878%, within three basis points of its highest print, from a low of 1.046%.
Now compare. The American thirty-year at 5.246% against the Japanese thirty-year at 4.016% leaves a differential of about 123 basis points. In ten-year paper, 4.649% against 2.878% leaves 177 basis points. The differential is narrower at the long end than in the belly, and Japan's own curve between ten and thirty years, at roughly 114 basis points, is nearly twice as steep as the American equivalent at around 60.
For a generation, the arithmetic facing a Japanese life insurer or pension fund was simple. Domestic long paper yielded almost nothing, so the money went abroad, predominantly into Treasuries, and the currency hedge was the only real question. That arithmetic has changed. A Japanese institution can now buy a thirty-year JGB at 4.016% with no currency risk and no hedging cost, against 5.246% in a foreign currency that requires hedging out of income that no longer covers it.
That is the threat to the Treasury market, and it sits in the underlying arithmetic, where no intervention reaches. The repatriation pressure does not need a crisis or a policy decision. It needs only the passage of time and the ordinary reinvestment of maturing positions, and the custody data suggests it is already underway.
Against that, the currency itself looks almost calm. The Dollar-Yen pair trades at 158.90, below its fifty-day average at 160.43 and just above its two-hundred-day at 157.86, having come off a high near 164.00 with daily momentum at 22.87. Across the intervention window, the fifteen-minute chart runs from 163.74 down to 155.23, a range of more than 850 pips in two legs. The Dollar Index at 99.51 sits beneath both its own averages with momentum at 13.81, which says the Yen's recovery is part of a broader Dollar softening rather than a purely Japanese event.
A hawk running out of instruments
The final piece of the picture arrived this week, and it removes the alternative.
Consumer prices came in exactly on consensus on all four lines, with core at 2.5% over the year, the softest since January. Producer prices were softer than expected on three of four lines, with the headline flat on the month against 0.2% forecast and the annual rate down to 4.7% from 5.5%. Retail sales then landed at -0.6% against +0.1% expected, with the control group at -0.4% and the ex-autos measure at -0.3%. Consumer sentiment fell to 51 against 54.5 expected and 55.2 previously, with the expectations component down to 50.6 from 55.4.
Demand is rolling over. And yet one-year consumer inflation expectations rose to 4.3% from 4.2%, with the five-year holding at 3.3%.
The rate market has drawn the obvious conclusion. The probability of a move to 3.75%-4.00% at the September meeting has fallen to 28.57%, from 38.14% two days earlier. October now carries 48.50%, down from 62.50%. December sits at 82.43%, down from 95.28%, though January remains 98.50% priced for one hike. On the conditional distribution, December still carries a 37.8% chance that nothing has happened at all and a 16.4% chance of two moves.
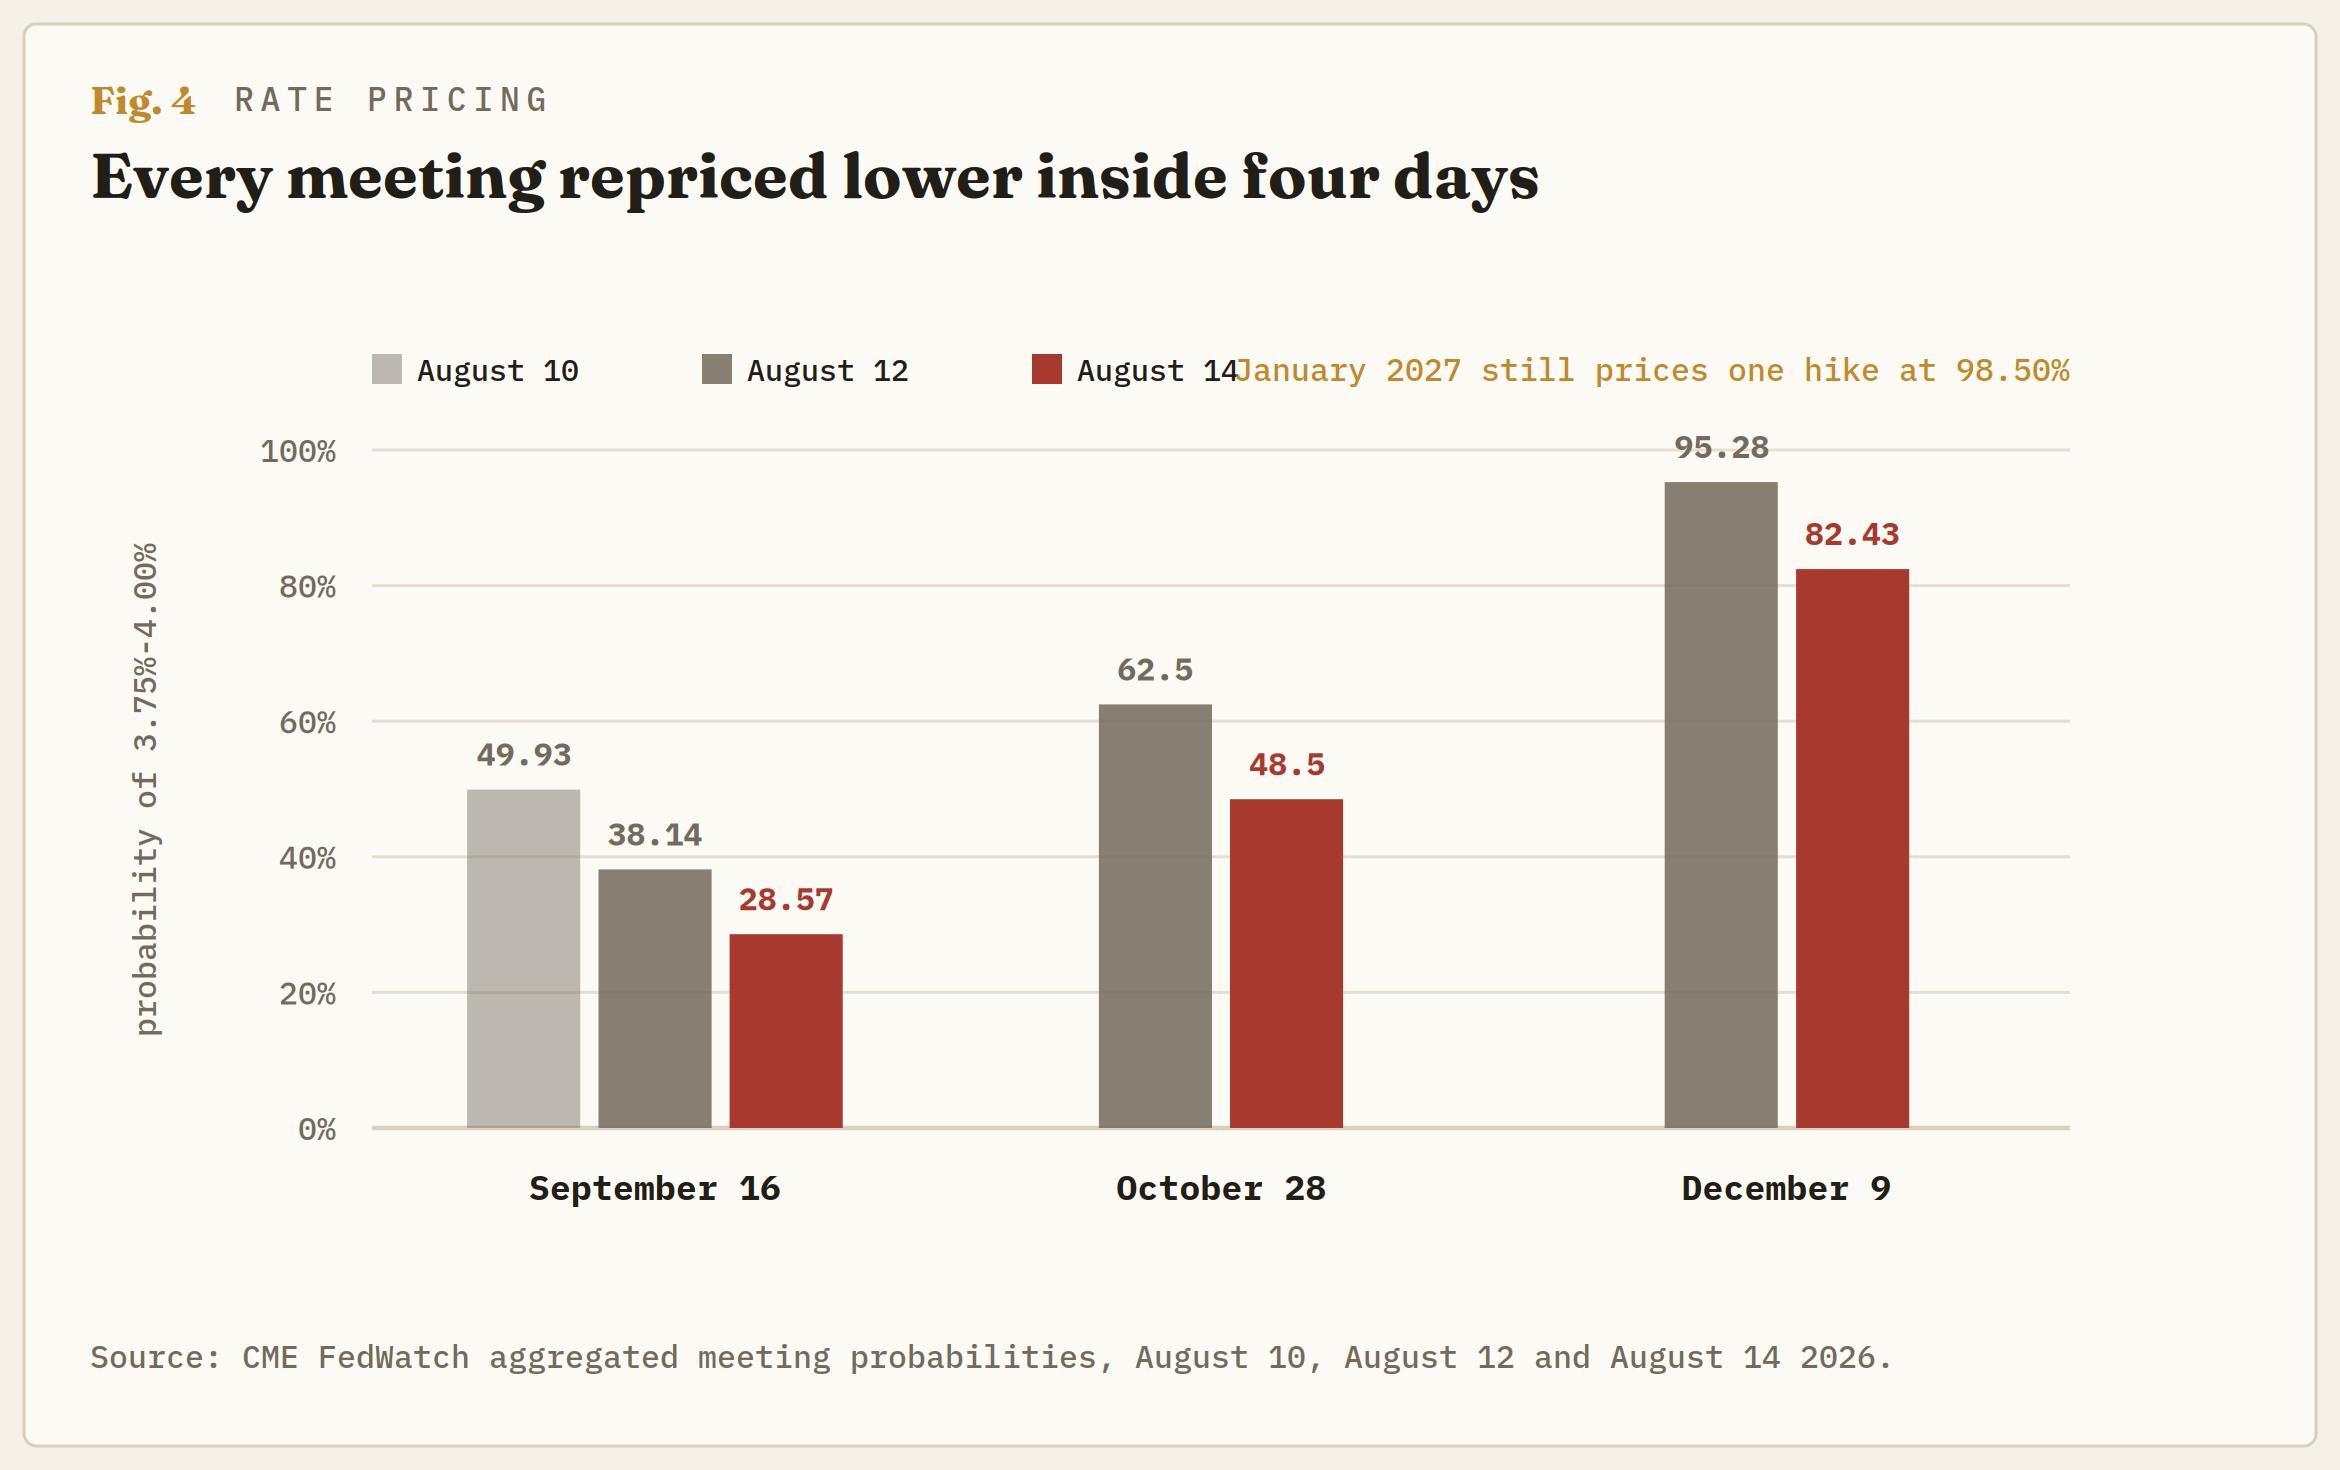
So a Chair who believes policy is not restrictive enough is watching the case for rate hikes drain away in real time, while the one measure that would justify hiking, household inflation expectations, moves the wrong way. Rates are becoming unavailable. That leaves the balance sheet as the only instrument, and the balance sheet is the one that has been growing, in bills, at the front end, precisely where it does least to the long rates that actually matter.
The fork
This does not resolve at a level, which is why there is no map for it.
It resolves on a single question: whether the balance sheet is a monetary instrument or a market utility. Those two uses are now in direct conflict. Shrinking it to tighten policy means withdrawing the bill bid at the moment the Treasury is issuing heavily and foreign official holders are stepping back. Maintaining it as a utility means the Chair's stated preference for a smaller balance sheet stays rhetorical, and the only tightening instrument left is one he cannot use.
Three observables settle it, and none is a price.
Watch the bill line in the weekly release. If Treasury bill holdings stop growing, the balance sheet has been repurposed as a tightening tool and the front end loses its sponsor. Watch the custody account for foreign official holders. Another quarter of a trillion out of it would say the repatriation is accelerating and the long end has a supply problem no domestic buyer is positioned to absorb. And watch the foreign official repo line for the first non-zero print, because the day that facility is actually drawn is the day the market finds out whether the promise it has been pricing was ever real.
The Jackson Hole symposium at the end of this month is the natural forum for the answer. A framework speech that treats the balance sheet as a policy instrument and a framework speech that treats it as financial infrastructure imply completely different paths for the long end, and the difference between them is worth considerably more than the twenty-five basis points everyone is arguing about.
For now the position is this: a facility that has never been drawn is being priced as a working backstop. A balance sheet that is supposed to be shrinking has grown by $116 billion. The buyer it replaced held duration and the buyer it became does not. The thirty-year is at its highs and it has been telling this story for months, to an audience watching the wrong instrument.
Author

Joshua Gibson
FXStreet
Joshua joins the FXStreet team as an Economics and Finance double major from Vancouver Island University with twelve years' experience as an independent trader focusing on technical analysis.

















