Winners and losers from 2021

OK boys and girls, the game is over. Let’s see who won and who lost! And what we can learn from this round of the never-ending Game of FX.
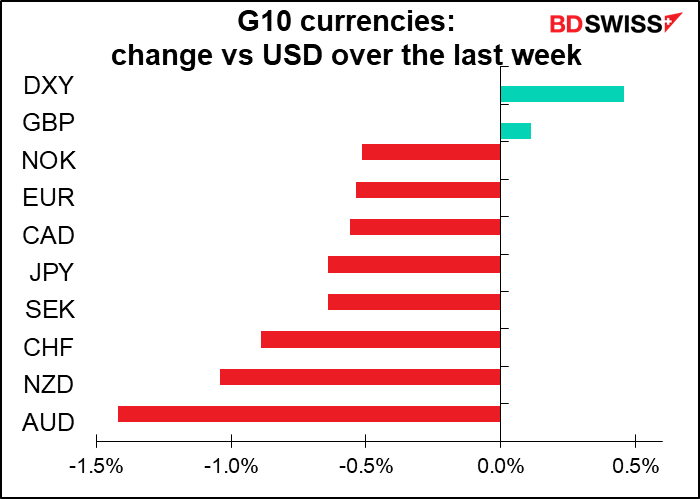
G10: the majors
Within the G10 – the currencies of the main industrial economies – CAD was the big winner. In fact, it was the only winner vs the USD, which therefore comes in #2.
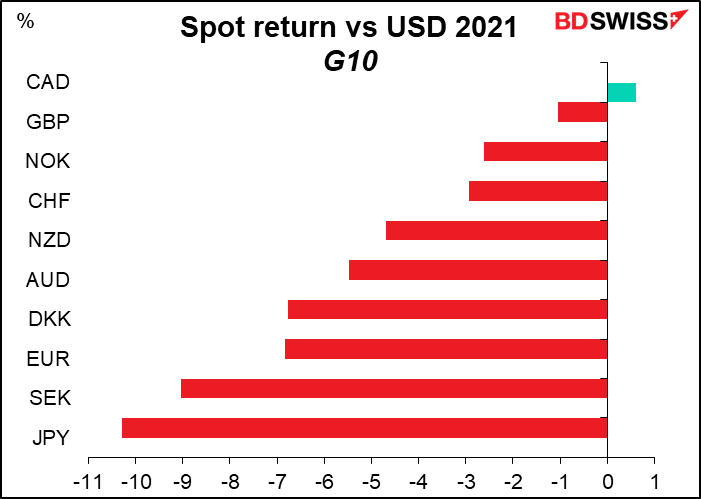
There were two reasons for CAD’s success. First off was no doubt the 55% increase in the price of West Texas Intermediate (WTI), the benchmark US crude oil. Secondly was the Bank of Canada’s early moves to normalize monetary policy. On the one hand it was the most aggressive central bank, expanding its balance sheet by around 5x in response to the pandemic. On the other hand, it was the first central bank to start reining in its extraordinary aid; it began tapering its bond purchases in Oct. 2020 and then gradually phased them out, ending them in Oct 2021.
Then again, perhaps NOK should’ve benefited more from those same factors. After all, Brent rose by 50% during the year and Norges Bank was the first of the industrial central banks to raise rates (it raised its deposit rate to 0.50% from 0.25% on Dec. 16th).
It’s no surprise that JPY was the worst-performing currency. While other countries started wrestling with above-target inflation during the year and talking about if not starting to normalize policy, Japan’s inflation rate remains well below target (core inflation is actually negative – deflation!) and there are no signs that they’re even “talking about talking about” normalizing policy.
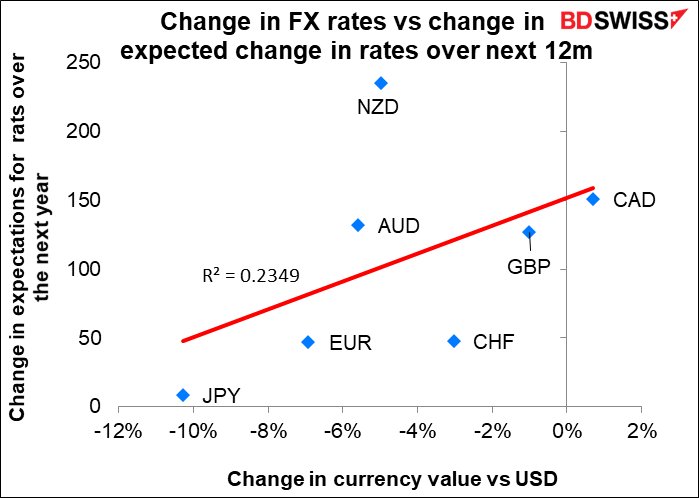
As for the others, the driving force during the year seemed to be the degree to which the central bank was expected to raise rates. The graph below shows the change in how much the market expects rates to change over the next 12 months on the Y-axis (vertical) and the currency’s performance vs USD on the X-axis (horizontal). The R2 of 0.60 means that there’s a 60% correlation between the two.
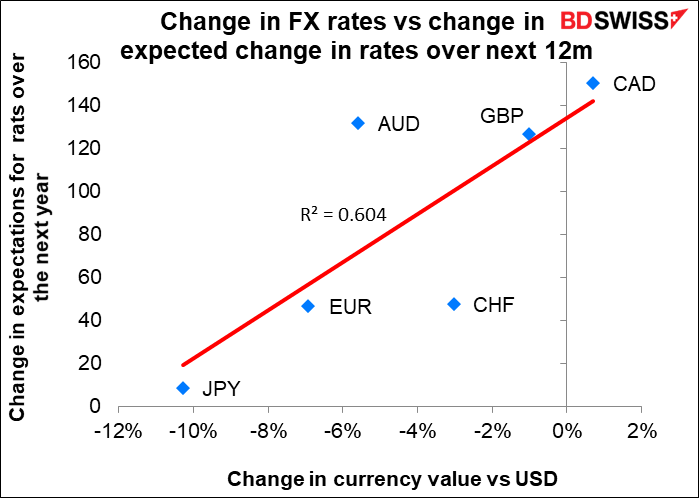
Observant readers will note that the graph does not include NZD. That’s because NZD messes up the relationship. If we include NZD, the R2 drops to 0.23. In other words, NZD was an outlier. I suspect this was caused by the country’s severe lockdown in August, which derailed the Reserve Bank of New Zealand’s tightening plans.
So to get a really accurate picture of what caused currency movements in 2021, you’d probably have to incorporate virus cases, too.
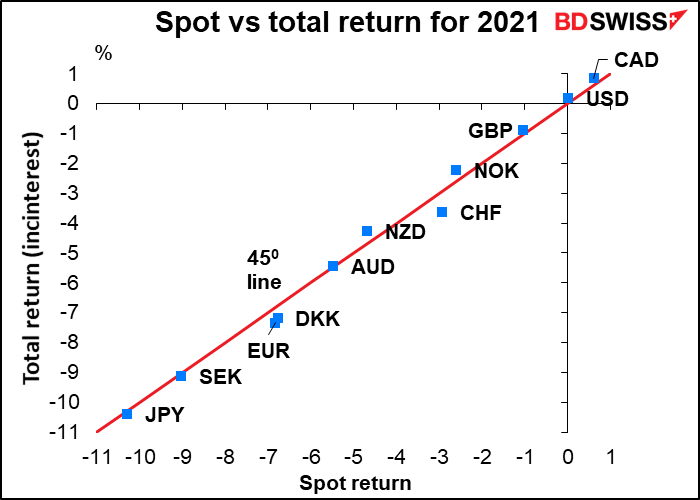
With currencies, there are two sources of return: the change in the spot price and the interest accrued while holding the currency. This graph shows the spot return on the X-axis (horizontal) and the total return, that is spot return plus interest, on the Y-axis (vertical). Note that they are almost all right on the 450 line, meaning that the two are virtually the same – there was almost no interest to be gained from holding any of these currencies. It ranged from +0.43% for NZD to -0.54% for CHF.
Getting back to central banks’ policy rates and the virus, I think these two factors will continue to be the main ones moving currencies during 2022. The idea of “monetary policy divergence” was put on hold in 2020 as all the industrial central banks cut rates to (or below!) zero. Now that they are in the process of normalizing rates, changes in the expected pace of normalization will probably be the #1 factor affecting currencies. And that in turn will depend to a large degree on the virus and peoples’ willingness to get vaccinated and to endure restrictions to get it under control.
EM: tremendous moves
Now let’s move onto the wider panoply of all currencies in the world, including emerging market (EM) currencies. Bloomberg has data on 142 currencies, including the above ones, so there’s a wide world out there to explore.
Top of the list was the fabled Seychelles Rupee (SCR), which appreciated by more than 50% against USD. #2 was the Zambian Kwacha (ZMW). Don’t go looking for these at your friendly FX broker, though; they aren’t widely traded. The only one on the list available to the retail trader is the Israeli Shekel (ILS).
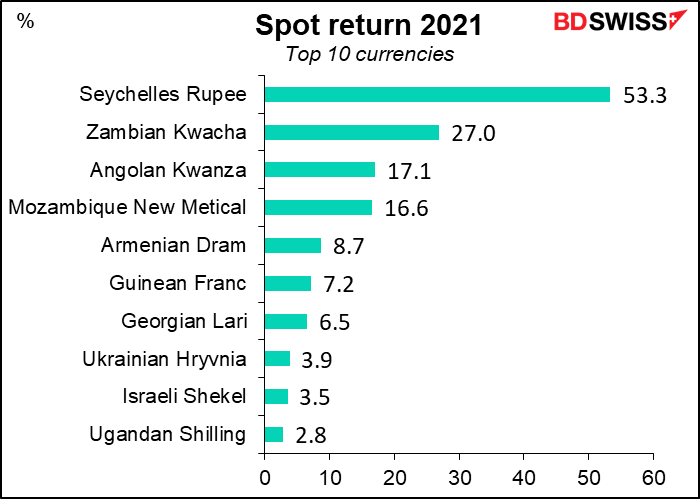
Why did SCR and ZMW soar so much last year? First off, we should note that they both collapsed in 2020 in the wake of the pandemic (both of them hitting a low of down around 36%) and then rebounded in 2021.
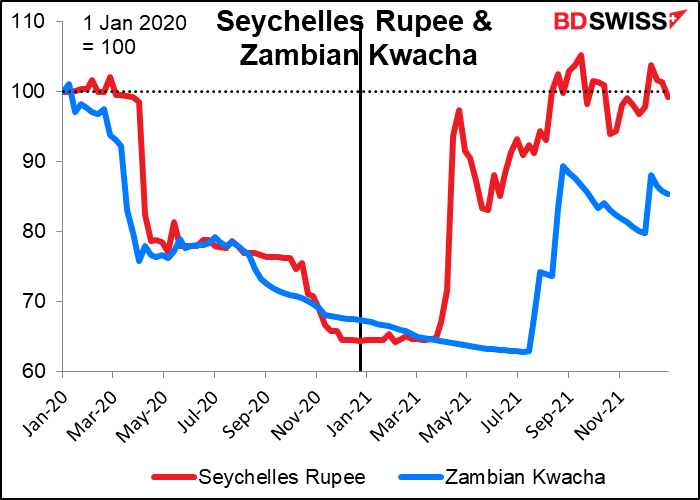
The Seychelles economy depends on tourism. The recovery of SCR coincides with the decision to lift restriction on visitors entering the country as of March 25th. The country also arranged for a loan from the IMF in July. With the pickup in tourism and the implementation of measures set out under the IMF-supported reform program, the economy and the currency turned around.
As for the Kwacha, this seems to be thanks to optimism about the election of a new president in August and hopes that he will be able to secure a bailout deal with the IMF and negotiate a debt restructuring. The rally in copper, which makes up more than 70% of export earnings for Zambia, also helped.
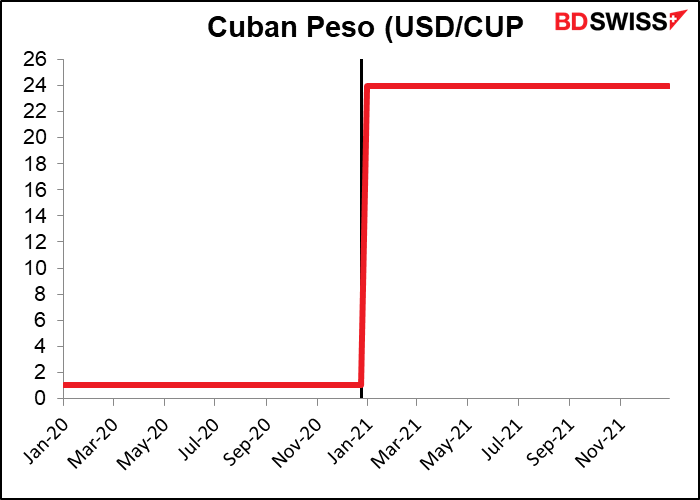
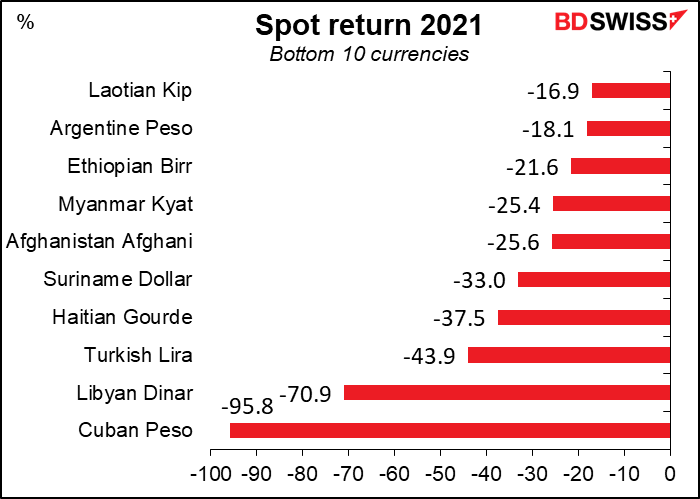
As for the losers… The Cuban Peso (CUP), the worst performer of the year, was actually quite steady. It just collapsed on Jan. 1st when the government ended the two-tiered currency system and the currency devalued from CUP 1 = $1 to CUP 24 = $1. After that it remained at 24 for the rest of the year despite inflation of around 70%.
As for the Libyan Dinar (LYD), on the one hand the country has oil, on the other hand it’s dissolved into regions ruled by feuding warlords. A national election scheduled for this month was postponed. I wouldn’t suggest it for your next holiday.
The Turkish Lira (TRY) remained near the bottom despite its stunning recovery in mid-December. That recovery only made a small difference; at its worst (Dec. 17th) the currency was down 55% YTD, so there would’ve been little difference in the return and certainly none in the order. Note that TRY did worse than the Haitian Gourde (HTG), a country that has sunk into gang violence and kidnapping since the president was assassinated in July; the Afghanistan Afghani (AFN), a country whose government fell to a band of medieval warriors; and the Ethiopian Birr (ETB), a country that’s descended into a full-blown civil war. That’s quite an accomplishment for the currency of a country at peace and with a fully functioning economy.
Please keep your eye on #9, the Argentinian Peso (ARS), because it may be the most interesting currency in the world.
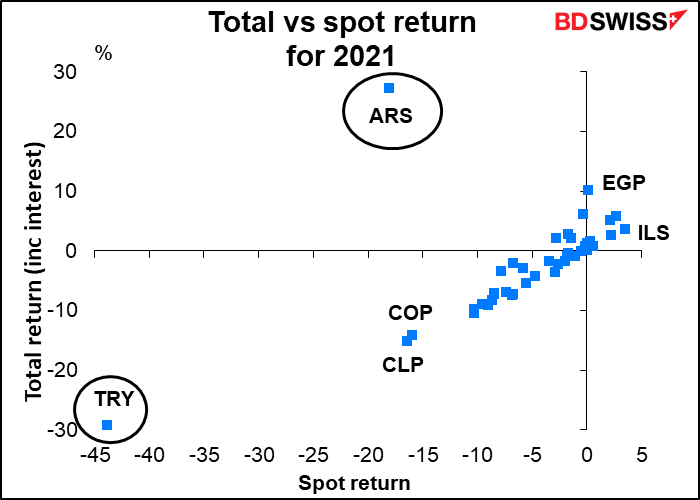
EM currencies: spot vs total return
Unlike with the G10 currencies, many EM currencies have positive interest rates and so the difference between spot return (the change in price of the currency) and total return (spot return plus interest) can be significant.
Unfortunately we don’t have data for all 143 currencies that Bloomberg tracks, only 44 of them (including the G10 currencies). So the following concerns only those 43.
Note two outliers: TRY and ARS. On the one hand, this shows how pitiful TRY is. The interest one receives from holding it doesn’t compensate at all for the depreciation of the currency.
On the other hand, ARS is astonishing. Despite being the 9th worst-performing currency in the world, after taking interest payments into account, it was the 2nd-best performing currency in the world, just edging out ZMW. (Note: we don’t know what interest rate ZMW or others on the major winners’ table have, except for ILS). The interest return from holding ARS was 55.45%, far outweighing the 18.1% decline in the spot rate for the currency. This is quite normal for ARS. For example, in 2020 the spot return was the 4th worst in the world at -28.9%, but the total return was #1 at 25.3% thanks to interest return of 51.9%, double that of the #2 high-yielding currency, TRY.
The experience of ARS shows what Turkey would have to do to restore confidence in its currency. Given what we’ve heard so far from the government, that doesn’t seem likely.
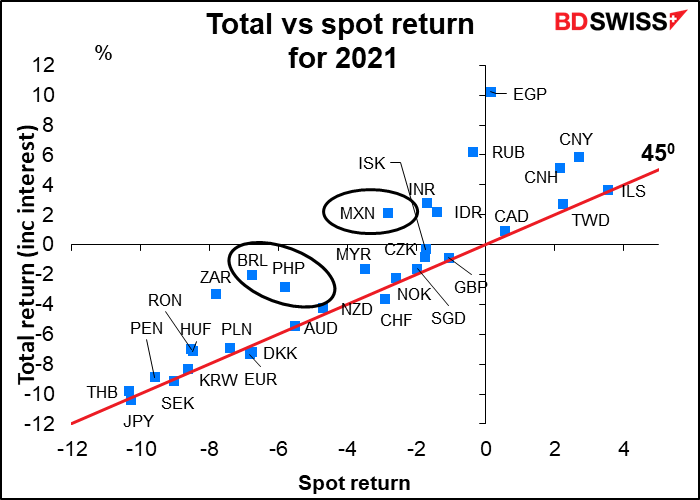
Let’s look more closely at the majority of those currencies. (The graph includes the G10 currencies as well.) The red line is at 450, meaning that currencies above that line have a higher total return than their spot return and below the line have a lower total return (i.e., negative interest rates). Some of the EM currencies, such as BRL, PHP, and MYR have significant interest return but still have a negative total return. On the other hand, please note MXN. This had a negative spot return but a positive total return thanks to its 5.1% interest rate. Furthermore it’s accessible to retail investors. People looking for carry trade ideas might want to look at MXN instead of TRY. (Note: I removed many of the Gulf country currencies from this chart because they were all clustered so tightly around zero that it was difficult to see the other currencies.)
Next week: US CPI, retail sales, UK short-term indicator day
There’s not that much on the schedule for next week.
The main feature in this inflation-obsessed market will be the US consumer price index (CPI) on Wednesday. The headline figure is expected to rise to an unbelievable 7.1% yoy from 6.8%. That would be the highest since Feb. 1982 (not much change there; the November figure of 6.8% is the highest since March 1982.)
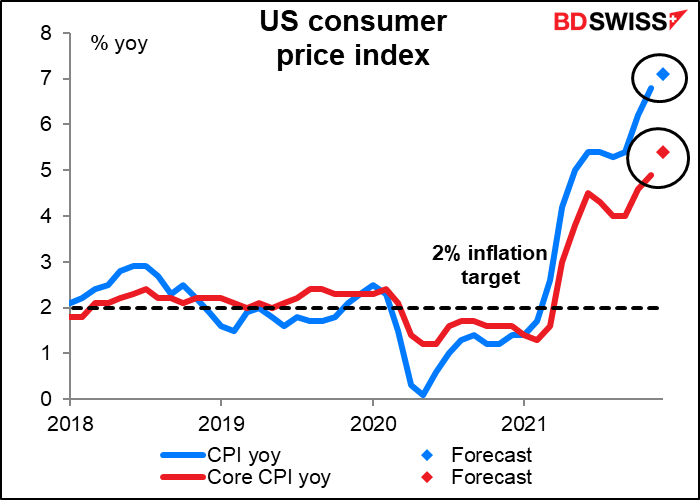
From what we’ve heard from various Fed speakers and what we’ve gleaned from the minutes of the December meeting of the rate-setting Federal Open Market Committee (FOMC), the Fed is deeply concerned about inflation. Committee members thought “inflation readings had been higher and were more persistent and widespread than previously anticipated.” “Participants noted their continuing attention to the public's concern about the sizable increase in the cost of living that had taken place this year and the associated burden on US households, particularly those who had limited scope to pay higher prices for essential goods and services.”
This is an important point. Austan Goolsbee, a professor of economics at the University of Chicago and former chairman of the President’s Council of Economic Advisors, recently had an article in The New York Times in which he argued that the US should produce different inflation rates to reflect the expenses that people of different incomes face, just as it produces unemployment data for people in different income brackets, because lower-income people face higher inflation rates but that isn’t reflected in policy. The Fed’s desire to see higher employment for lower-earning people may have to be balanced by its desire not to see these same people overly burdened by high inflation.
There will also be some other inflation data from the US on Thursday, when the US producer price index (PPI) will be released.
The Japanese version of the PPI – the corporate goods price index – comes out Friday morning. The FX market hasn’t paid much attention to this index for the last 20 or 30 years, but we’re now watching it like a hawk. (Well, maybe like a hawk that only wakes up briefly once a month.)
The Japan PPI is now rising by 9% a year, the highest rate since the early 1980s. It’s expected to rise by 8.8% yoy in December, not much of a change.
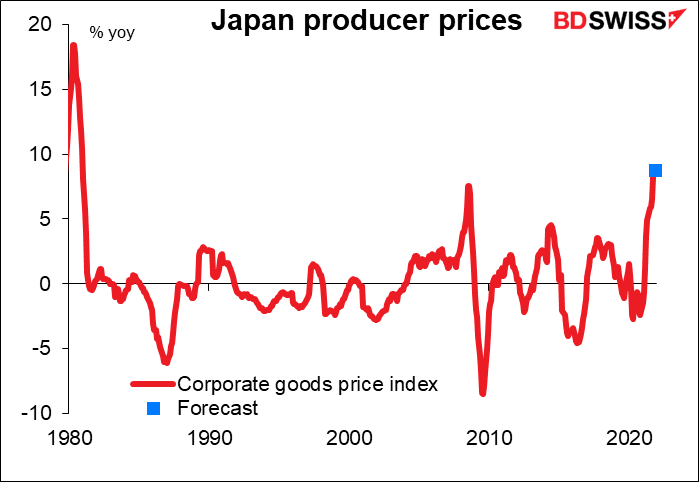
The rise is being driven by raw material prices, which were up an astonishing 75% yoy. Intermediate goods prices were up 15.7% yoy.
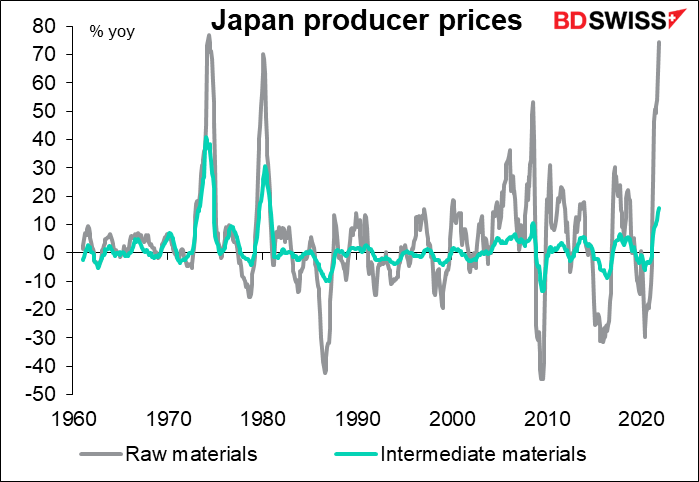
Up to now companies have managed to absorb higher input prices in their margins and haven’t passed them along to consumers, but the Bank of Japan’s short-term survey on economic conditions (tankan) recently showed that more and more companies were finding that they could pass them on. If they were to pass just a small part of these higher prices on, Japan might hit its 2% inflation target and the Bank of Japan could start to rein in its extraordinary monetary policies. That would be a major shift for the financial world, which has gotten used to Japan being a never-ending source of zero-cost money. That could mean a stronger yen and a weaker euro or Swiss franc as investors switched their funding currencies.
We’ll learn more about what the Bank of Japan is thinking about inflation, particularly in light of the Fed’s more aggressive stance, on Wednesday when Bank of Japan Gov. Kuroda will address the Branch Managers’ meeting.
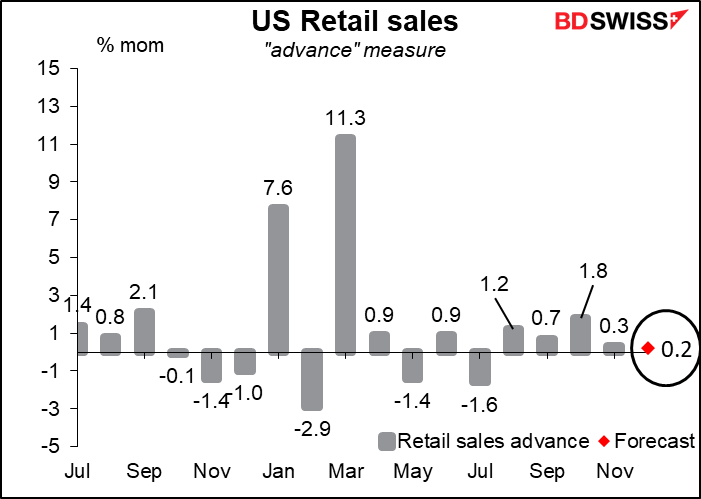
Getting back to the US indicators, US retail sales are expected to be up only slightly. Still, they’re expected to be up, which is better than being down. It would suggest that the upturn in consumer confidence seen in both the U of Michigan survey and the Conference Board survey for the month were real and significant improvements despite the worsening virus situation.
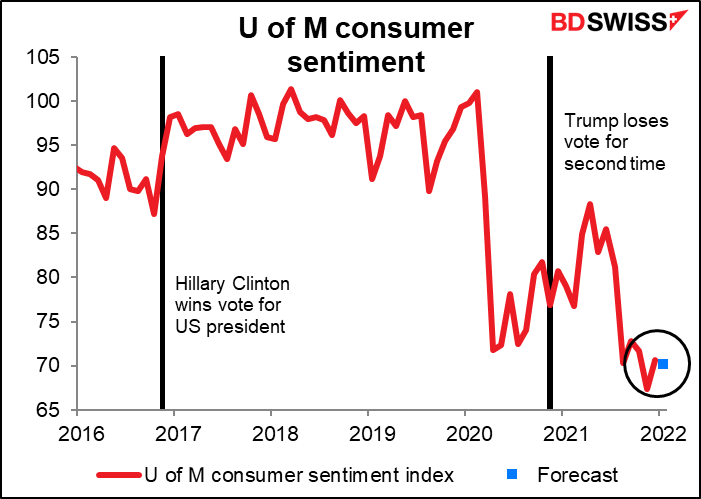
Speaking of which, the preliminary U of M consumer confidence survey for January will also come out on Friday. It’s expected to show little change in sentiment, which under the circumstances I’d way was pretty good – given the sharp increase in virus cases, I would think people would be more depressed (I know I am!).
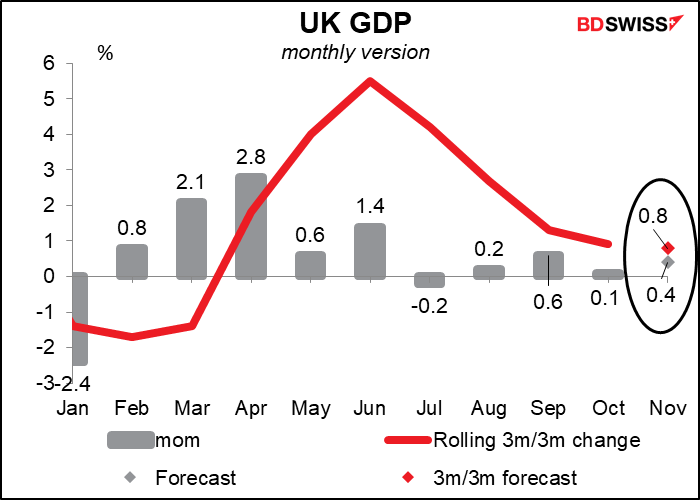
Friday is also the day for the UK short-term indicators, including GDP, industrial & manufacturing production, and trade. The GDP is the most important of the lot. It’s expected to show modest growth of +0.4% mom, consistent with the recent pattern (the average of the last three months has been +0.3% mom). I don’t think that’s going to cause any fireworks, but nor would it be slow enough to discourage the Bank of England from tightening policy further. In that respect I imagine it could be positive for the pound.
As for the EU, the main indicators of the week are unemployment on Monday and industrial production on Wednesday.
There are no central bank meetings during the week, but Fed officials will be active, particularly on Tuesday. On Tuesday there will be public events with three voting members of the FOMC (Cleveland Fed President Mester, Kansas City President George, and St. Louis Fed President Bullard), plus the Senate Finance Committee will hold a hearing on the (re)nomination of Fed Chair Powell. I doubt if Powell will face any concerted opposition; he is after all a Republican appointed by a Republican president and reappointed by a Democratic president. More to the point it will be interesting to hear his take and that of the other voters on the issues facing the Fed, namely when to start raising rates and how long after that to start reducing the balance sheet. Wednesday the Fed releases the fabled Beige Book ahead of the Jan. 26th FOMC meeting. Thursday the Senate Banking Committee holds a hearing on Gov. Brainard’s appointment as Vice Chair of the Fed. She should have no problems getting approved so the more interesting point will be just what she says about policy during the hearing. And Friday New York Fed President Williams, another voting member, speaks.

Author

Marshall Gittler
Trading Analysis


