Will Trump’s Stimulus Hint Turn Stocks Around?

After Thursday’s rise, stocks went ever deeper into red since. Driven by incoming bad coronavirus news both in the US and abroad, not even Friday’s strong employment data stopped the selling. Monday’s bloodbath even caused trading to be halted for quite some time. This hasn’t happened since September 2008. Stocks continued lower, yet made a comeback in today’s overnight session. Will it fizzle out again?
Let’s jump right into the weekly chart (charts courtesy of http://stockcharts.com).
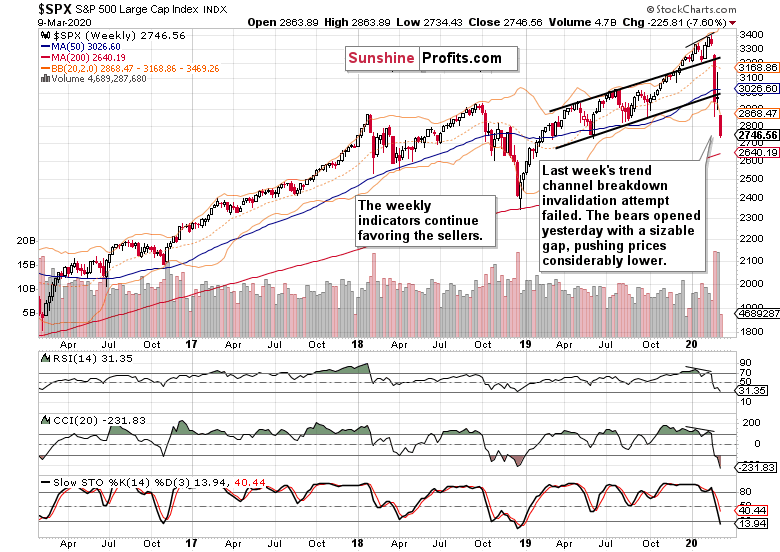
Last week’s upswing attempt has failed, and the bulls couldn’t invalidate the breakdown below the rising black trend channel’s lower border. Yesterday, the index has shaved off 7.5%, closing at the March and June 2019 lows. Will this support be strong enough to stop further selling?
We doubt that. The emergency 0.5% rate cut didn’t instill confidence in the market, and bad coronavirus news kept coming in. Maybe today’s lockdown of Italy is being cheered but the US infections rate just keeps going up while all the existing coronavirus mutations are presumably doing fine in the US. South Korea’s rigorous testing approach hasn’t been replicated yet in the States either. Neither has the Singapore’s contact tracing approach.
In other words, there’s no turnaround on the immediate US horizon, and the current monetary and fiscal response is being perceived as inadequate. But Trump has just hinted at possible stimulus measures on the way. Tax relief is being considered for his upcoming meeting with the House and Senate Republicans.
This news has sent S&P 500 futures around 4% higher, as they reached 2879. With the weekly indicators solidly in the bearish territory, let’s check the daily chart’s closing prices first, and elaborate on our action plan thereafter.
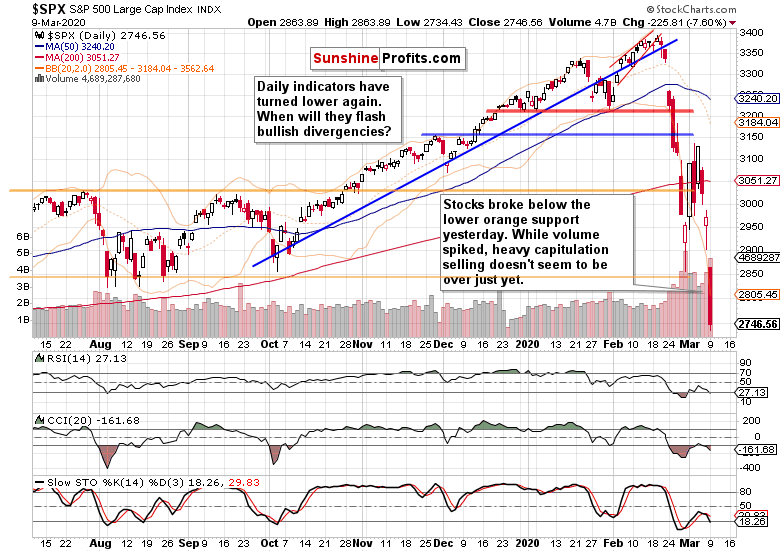
Monday’s downswing took stocks below the lower orange support. The volume was elevated, but not of the outrageously high kind typically associated with a washout bottom. Daily indicators have predictably turned lower, and the question for bottom fishers is whether they will flash reliable divergencies any time soon.
Today’s premarket upswing would favor the daily indicators to turn higher. But will the upswing stick? The bulls have already been at 2879 earlier today, which is above the lower orange zone. Yet, they have given up their gains as stocks change hands at around 2845 currently. This price action appears to be no more than verification of the breakdown below the orange support.
Let’s check the message of the Force Index.
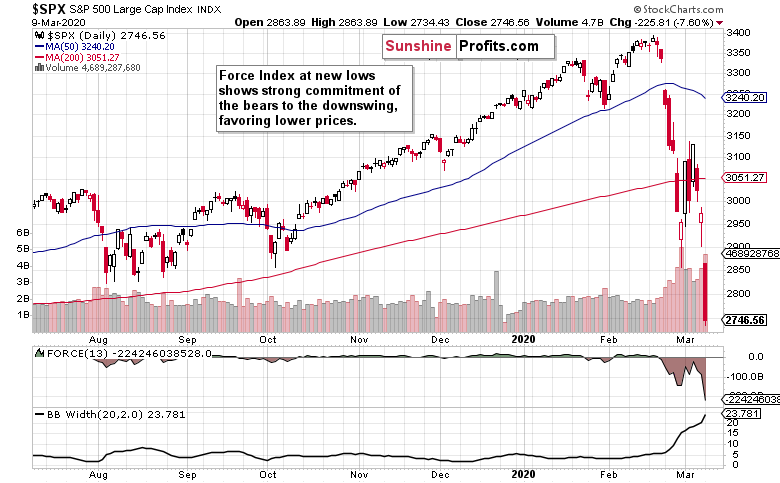
Force Index is a unique type of oscillator, because it’s not built just around prices. It takes into account volume, and that’s its key advantage. Designed by Alexander Elder, the indicator has much to say about the current setup.
Yesterday, it has made a new low, beating the late-Feb bottom. Bears are putting their money where their mouth is, and that means that selling isn’t likely over just yet. Or have we seen a positively breaking coronavirus development or an overwhelming monetary or fiscal policy response that has the power to turn the market truly around?
In a word, not yet. Unless the contemplated stimulus achieves that, prices are more likely to go down that to go up. Despite all the volatility, a true panic hasn’t apparently yet set in.
Taking all the above into account, opening short positions is justified at the moment of writing these words. Due to the sizable volatility, we have to work with wide enough stop-losses and initial downside targets to avoid being narrowly taken out of the market when we get the prevailing directional move right. In such times, we’ll be better off managing the open position accordingly. Remember that you can adjust your position sizing if the short position would mean risking a higher trading account percentage than you’re comfortable with. Position details are reserved for our subscribers.
Good news! At the moment when you’re reading this article (11 o’clock Eastern Time), our open position is already over 50 points profitable!
Summing up, last week’s upswing attempt has predictably fizzled out, and both the weekly and daily charts are sending bearish messages. Despite the considered stimulus, the downswing appears likely to have further to go on the downside before the market regains confidence in a lasting turnaround. Therefore, opening short-positions is justified.
Want free follow-ups to the above article and details not available to 99%+ investors? Sign up to our free newsletter today!
Author

Monica Kingsley
Monicakingsley
Monica Kingsley is a trader and financial analyst serving countless investors and traders since Feb 2020.


