Will Record S&P Highs Fail Again?
Chaos Clinic for 6/21/2019
Today is the Summer Solstice. And the S&P has made new record highs. Earlier this year, new record highs faded quickly. Will they do so again?
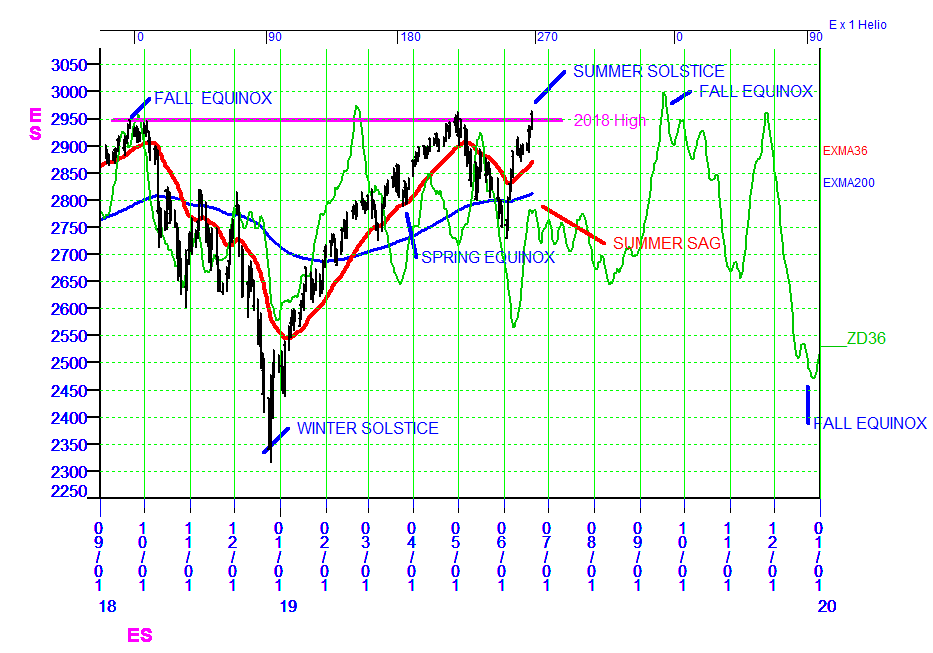
I think they will, for several reasons. The primary reason I think so is this chart, showing my ZD36 energy forecast. It is the green line on the chart. This energy forecast is computed only from the first trade date and planetary positions. No price data is used. It can be computed as far in the future as desired. This forecast is computed with my WinXGO software, available at MoneyTide.com
The vertical scaling of energy to price is arbitrary. The 36 day filter smooths the turns, so they may be early or late by about a week. But the forecast gives a good idea of where prices are headed. Right now, as the S&P futures have made another move above the 2018 high, the ZD36 is showing a choppy summer sag down into August. The pop up to new highs was fueled by news that the Fed might cut interest rates. The next FOMC meeting is July 30-31, close to the ZD36 low. An actual interest rate cut could then fuel the forecast rally, up into the fall equinox.
Of interest is the action of prices within each natural quarter. Prices went one way from the 2018 fall equinox to the winter solstice, and one way from there to the 2019 spring equinox. Then they made 3 moves between the 2019 spring equinox to the current summer solstice. The ZD36 forecasts 2 moves between this summer solstice and the fall equinox. And 3 moves between it and the 2019 winter solstice. Frequency doubling is a precursor to chaos.
I track the ZD36 forecasts with a 36 day and an 200 day exponential moving average. Right now the 200 day is sloping slightly up, suggesting the fall highs could again be record
highs. The 200 day EXMA is probably support for an August low. And a last quarter decline would see the 36 day EXMA cross the 200 to the downside.
There are other reasons I think the S&P high may fade. First, this was a rally of hope, not one of surprisingly good data. Second, the bull market leaders are struggling. Third, I see money flowing into gold, dramatically.
This content was published on Dr. Al Larson's Chaos Clinic which you can attend each Friday for free.
Dr. Al Larson has developed a complete Chaos Model of Markets, four unique courses that let you become a Certified Chaos Trader, some very unique eMylar fractal pattern overlays, and tools that permit forecasting individual stocks and markets years in advance. You can also sign up for a free weekly email, and attend a free Chaos Clinic on Fridays. To learn more, click on the author's profile.
Be sure to sign up for the free weekly email!
Author

Dr. Al Larson, PhD
MoneyTide.com
Dr. Al Larson holds a Ph.D. in Electrical and Computer Engineering from the University of Wisconsin. He is a 1964 Distinguished Graduate of the U. S. Air Force Academy.


