Will job market from hell support Gold?

April job report shows a terrible US labor market. Coronavirus destroyed 20.5 million jobs, pushing the unemployment rate to almost 15 percent. How far does the number reflect reality – and what does it actually mean for the gold market?
Apocalypse in the US Labor Market
14.7 percent. Remember this value well, as it will go down in history. This is the official US unemployment rate for April calculated by the Bureau of Labor Statistics. The unemployment rate soared from 3.5 percent in February and 4.4 percent in March. As the chart below shows, the spike is really historic, as such high level has not been seen in modern history.
Chart 1: US unemployment rate from January 1948 to April 2020
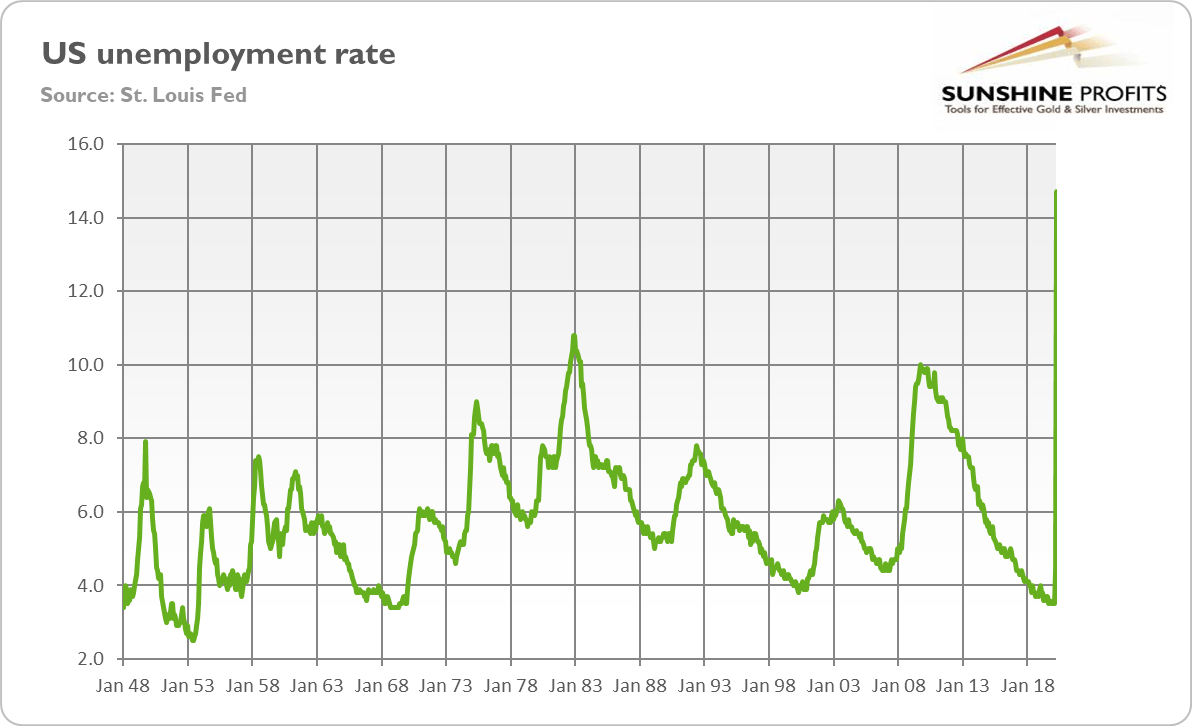
Indeed, the number is much higher than the peak noted during the Great Recession, which was considered to be a catastrophically high value. The current unemployment rate is the highest since the Great Depression.
This mammoth increase in the unemployment rate was driven by the giant losses in the nonfarm payrolls. The coronavirus destroyed 20.5 million American jobs in April, an unprecedented monthly change. Indeed, as the chart below shows, the number of destroyed jobs has been the largest since the 1939, when the data series begins.
Chart 2: US nonfarm payrolls from February 1939 to April 2020
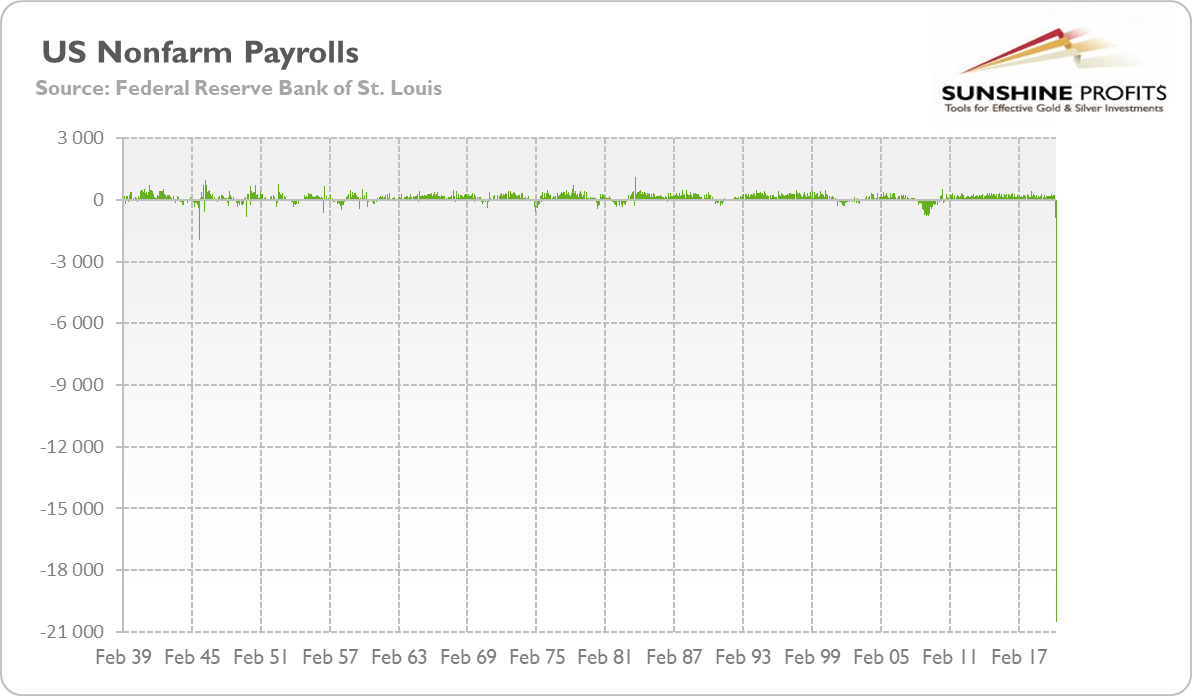
The job losses were widespread, but – unsurprisingly – leisure and hospitality was the hardest hit, losing 7.6 million of jobs. Interestingly, during the health crisis and the greatest pandemic since the Spanish flu, even healthcare and social assistance lost 2.1 million of jobs.
Importantly, the real situation in the US labor market is even darker than the Employment Report suggests. Why? First, although the Great Lockdown is gradually unwinding, investors should remember that in the establishment survey, “workers who are paid by their employer for all or any part of the pay period including the 12th of the month are counted as employed, even if they were not actually at their jobs.” It means that the current report does not count workers who lost their jobs after April 12 nor people on temporary layoff. As the BLS admits itself, if millions of Americans who have been furloughed and expect to return to their jobs are counted as unemployed, the unemployment rate would have been almost 5 percentage points higher.
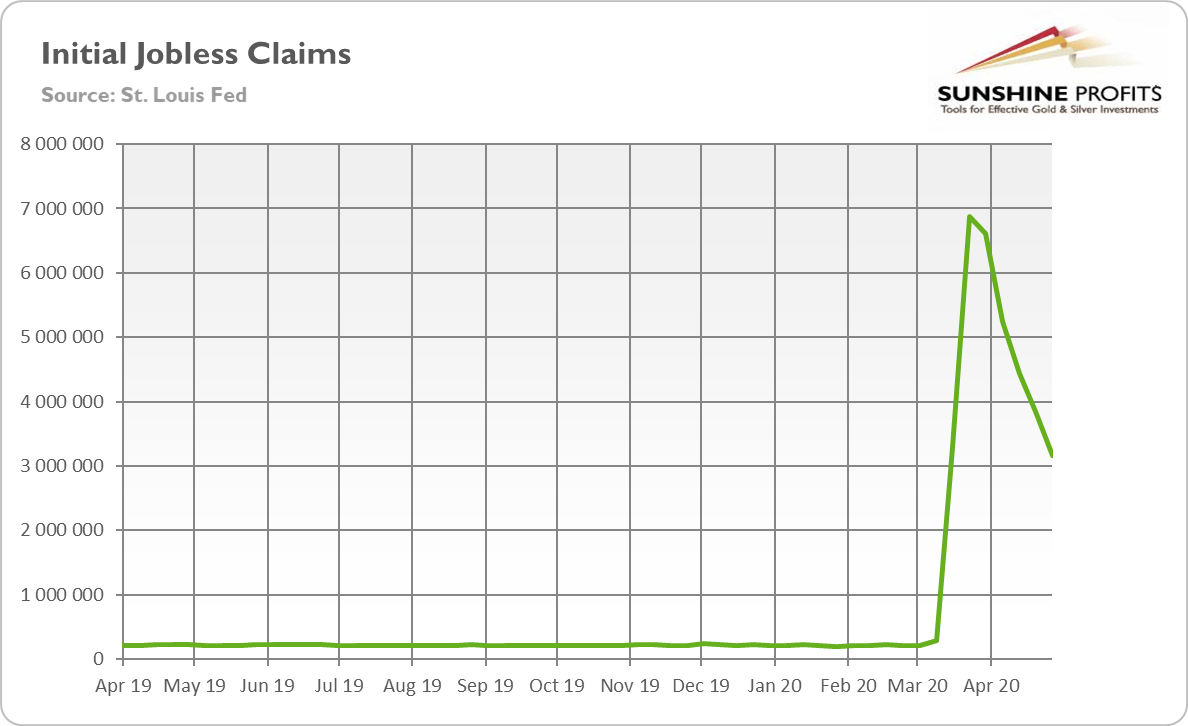
Second, the initial claims paints much grimmer picture of the US labor market. As the chart below shows, in the week between April 25 and May 2, about 3.2 million Americans applied for unemployment benefits. It means that about 20 million of people became unemployment in March and about 33.5 million since the beginning of the COVID-19 epidemic. Meanwhile, the Employment Situation Report shows that there are “only” 23.1 million of unemployed people in the US…
Chart 3: US initial jobless claims from April 2019 to May 2020
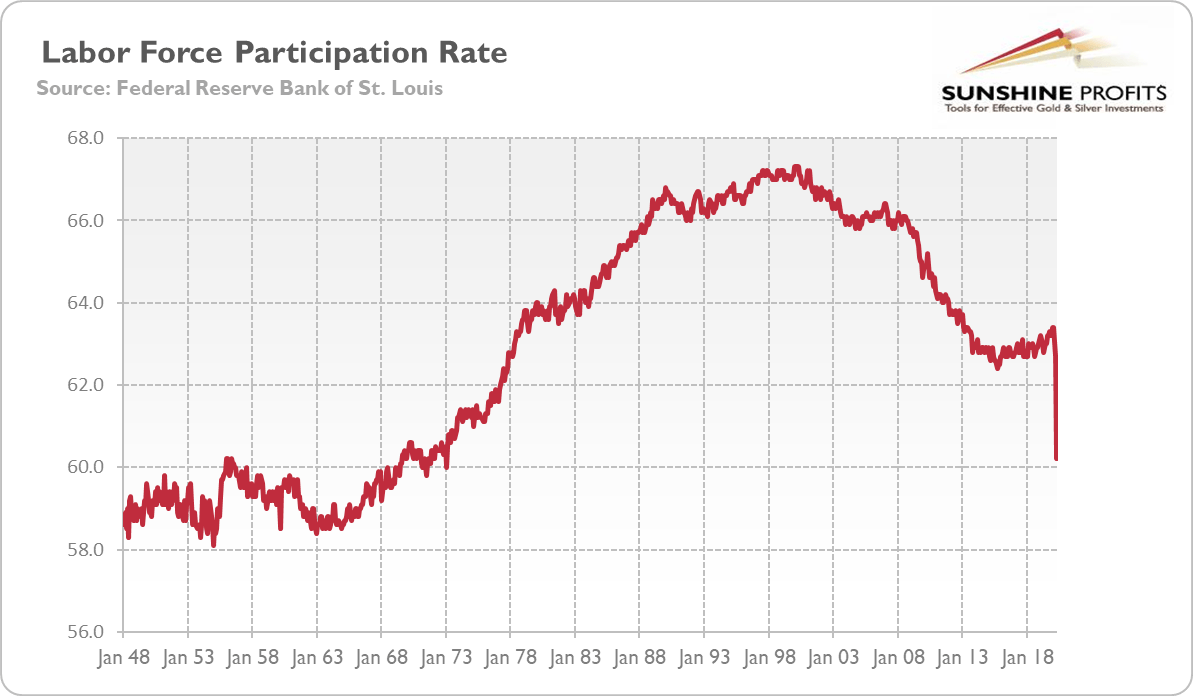
The partial explanation – and this is the next reason why the US labor market is worse than the official data shows – is that some people who lost jobs, are not counted as unemployed, because they dropped out from the labor market. Indeed, the participation rate, i.e., the ratio of people in the labor force to the civilian population, decreased from 63.4 percent in February and 62.7 in March to only 60.2 in April, as one can see in the chart below. It means that more than 8 million of Americans gave up and removed themselves from the labor market. Please note that the participation rate plunged to the lowest level since January 1973 when only a part of women entered the labor market.
Chart 4: US civilian labor force participation rate from January 1948 to April 2020
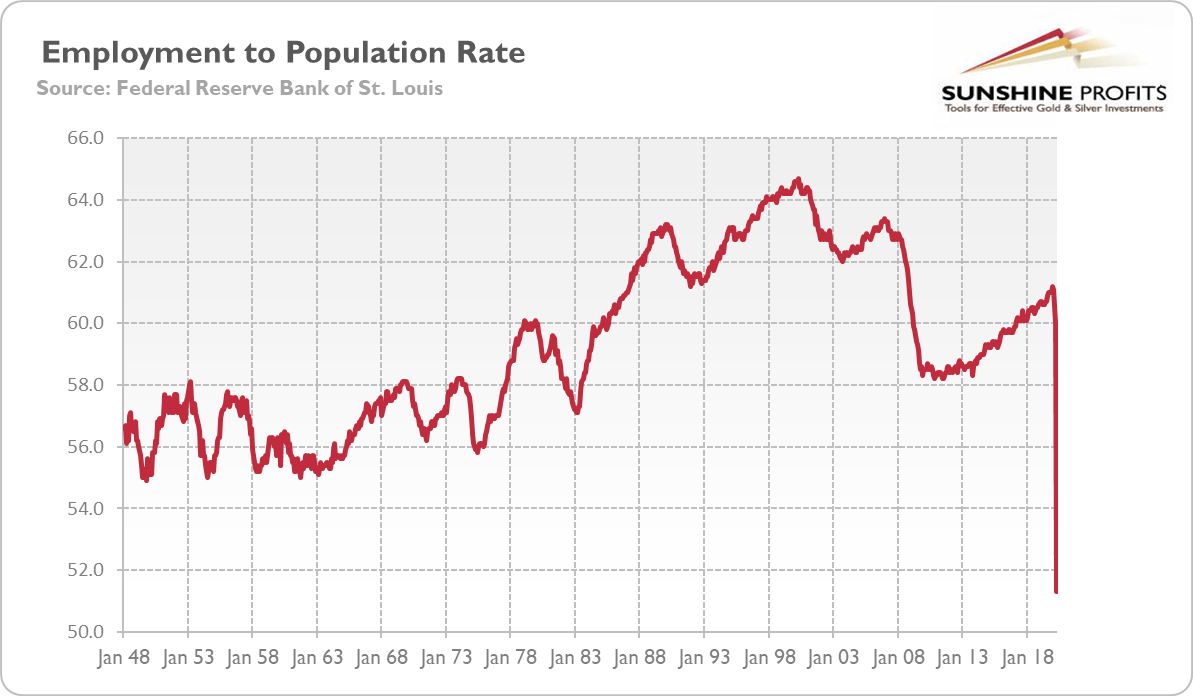
And the employment-population ratio, which measures the number of people employed against the total working-age population, also plunged from 60 in March to 51.3 percent in April, the lowest rate and largest over-the-month decline in the history of the series, as the chart below shows. It means that only half of the Americans in the working age have employment.
Chart 5: US employment to population ratio from January 1948 to April 2020
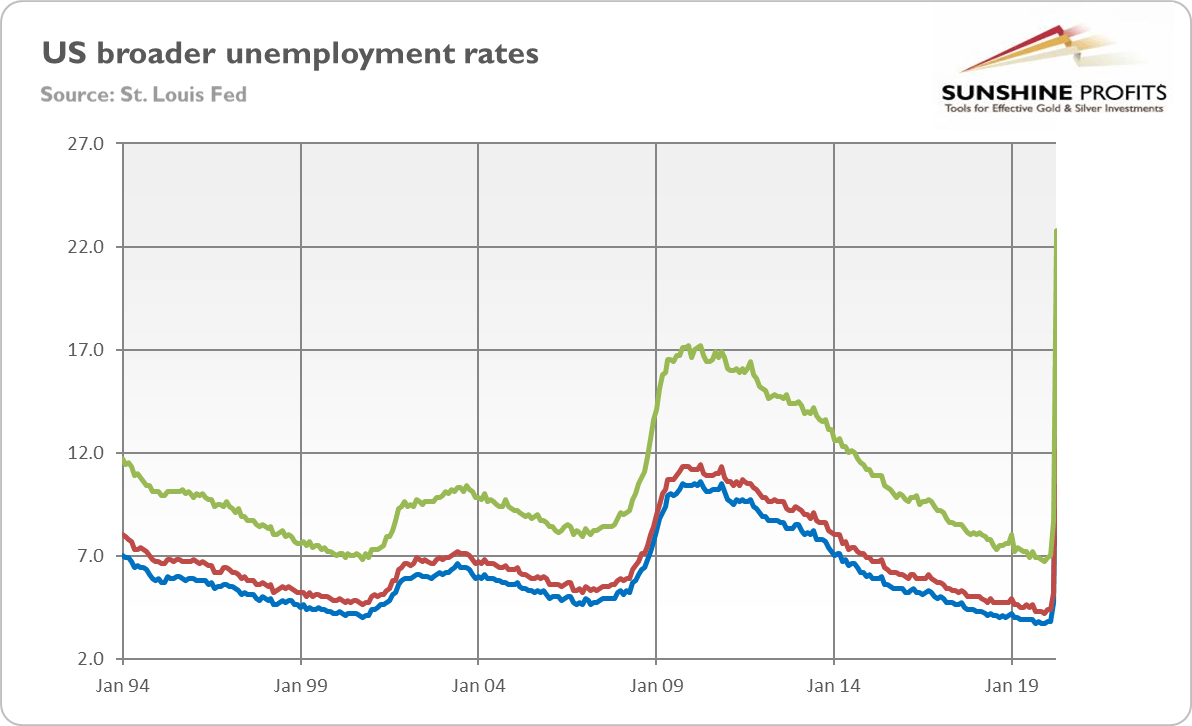
For all these reasons, a better picture of the havoc might be painted by the broader unemployment rates. For example, the U6 unemployment rate, which also includes people marginally attached to the labor force and people employed part time for economic reasons, soared from 7 percent in February and 8.7 percent in March to 22.8 percent in April, as the chart below shows.
Chart 6: US broader unemployment rates (U4 – blue line; U5 – red line; U6 – red line) from January 1994 to April 2020
Implications for Gold
What does it all mean for the gold market? The April Employment Report is the jobs report from hell. There is true horror in the US labor market right now. It will, of course, recover, after the Great Lockdown ends. However, we don’t think that the labor market will return to the pre-crisis level. The plunge in the labor participation rate shows that some people already withdrew from the labor market. Some of them will return, but not all of them. And some of the unemployed people will also drop out from the labor market. It means that with so many people unemployed or out of the labor market, the economy will growth rather slowly (after initial recovery that looks statistically great due to low base), which should support the gold prices.
However, the most important consequences for the gold market will be through the economic policy and higher inflation. Let’s be honest, already with record low unemployment rate, the Fed started to consider the changed in its inflation target. Now, with the unemployment rate at 15 percent (and possibly higher), the doves will completely dominate the FOMC. In such a macroeconomic environment, all policymakers will focus on providing full employment. Nobody will care about a slightly higher inflation. Of course, the supposed slightly higher inflation could quickly get out of control. We do not say that this is going to happen for sure – what we mean here is that nobody will listen to monetary hawks, if any left, when the unemployment rate is so high, especially in the election year. Thus, the chances of higher inflation are higher, and they should support demand for inflation hedges such as gold.
Want free follow-ups to the above article and details not available to 99%+ investors? Sign up to our free newsletter today!
Want free follow-ups to the above article and details not available to 99%+ investors? Sign up to our free newsletter today!
Author

Arkadiusz Sieroń
Sunshine Profits
Arkadiusz Sieroń received his Ph.D. in economics in 2016 (his doctoral thesis was about Cantillon effects), and has been an assistant professor at the Institute of Economic Sciences at the University of Wrocław since 2017.


