Will higher Treasury yields begin renew dollar strength?

Market Overview
Financial markets continue to run in this air of caution amidst the backdrop of trade tensions where there is seemingly a lack of willingness to take on risk. This comes despite a notable shift higher on Treasury yields in the wake of Friday’s stronger than expected earnings growth from the Non-farm Payrolls report. The US 10 year yield added 4.5 basis points yesterday and is pushing back towards 3% again, whilst 2 year yields push ever further above 2.7% to 10 year highs too. Although yield differentials are pulling decisively in the dollar’s favour in recent days there is has yet to be a notable reaction on forex markets. Aside from a mild move higher on Dollar/Yen (which is beginning to slip back again today), there has been little move of any note against the euro or sterling. Although there has been a slight move in the dollar’s favour this morning, but broadly the dollar has failed to significantly gain, with the dollar index subsequently broadly flat. There is a slight weakening of the Chinese yuan which needs to be watched (as a sign of the ongoing concerns over trade) but even against the Aussie and the Kiwi (higher risk commodity currencies) there has yet to be any real weakening this week. Perhaps the inflation data, which begins with the PPI today, could be the catalyst for a move in the dollar’s favour once more. However, for now it is notable that the dollar has failed to ignite this week. Perhaps those stretched dollar long futures contracts positioning are having a restrictive impact after all.

Wall Street closed with decent gains as the Dow climbed +0.4% along with the S&P 500 (also +0.4% at 2888). However, with US futures broadly flat this morning, Asian markets remain cautious, with the Nikkei -0.3%. European markets are mixed in early moves. In forex, there is a slightly cautious look to the positioning, with the yen outperforming, whilst the dollar is clawing back a few losses. It is interesting to see the Canadian dollar making ground amid suggestions of progress in the NAFTA renegotiations. In commodities, despite the apparent risk aversion, there is a mild slip on gold, whilst oil continues to pull higher amid concerns over the impact of Hurricane Florence in the US.
It is a fairly quiet European morning for traders, aside from a look at the Eurozone Industrial Production at 1000BST which is expected to fall by -0.5% for the month on July (-0.7% in June) which would take the year on year data back to +1.0% (from +2.5% in June). US inflation starts to come into focus for the week, with US PPI (or factory gate inflation) for August at 1330BST which is expected to see headline PPI slipping a touch to +3.2% (from +3.3% in July) and core PPI flat at +2.7% (+2.7% in July). The EIA oil inventories are at 1530BST and are expected to show crude stocks in drawdown by -0.8m barrels (-4.3m last week), distillates building by +1.8m barrels (+3.1m last week) and gasoline building by +1.5m (+1.9m last week).
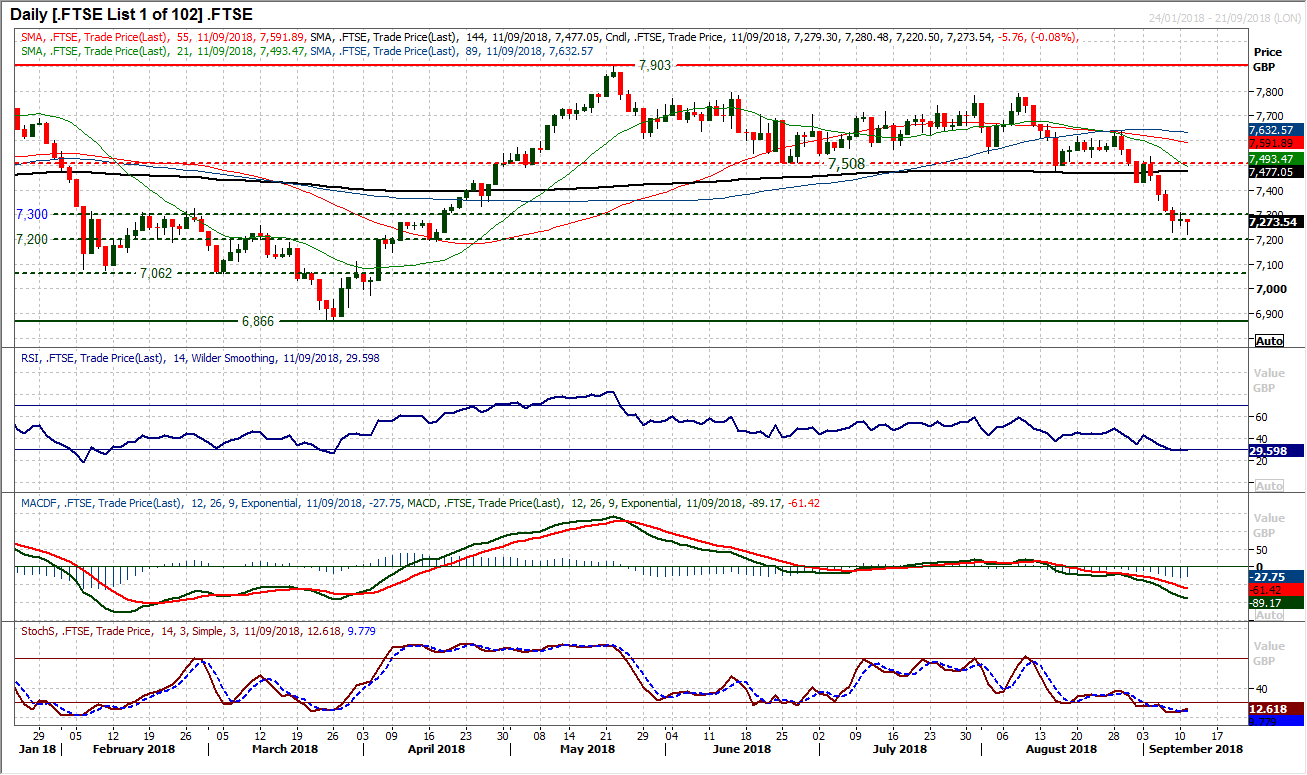
Chart of the Day – FTSE 100
The FTSE 100 has closed the past three sessions all within 6 ticks, but by no means does that reflect the moves on the market. In each of those three sessions, the market has pulled lower only for the sell-off to be supported. Friday and Tuesday both rallied over 50 ticks into the close and this rebound was especially pertinent yesterday with an arguable bull hammer candlestick. Although the market closed 6 ticks below the open (which is not a conventional bull hammer), the intraday recovery is a strong reaction that means today’s session is now key. The market has been threatening a recovery for a few days and with the momentum indicators stretched this is a time where a rally is likely to build. The hourly chart shows this with bullish divergences present across the hourly momentum, which certainly suggest that the prospects of a technical rally are growing. The bulls will be looking for a decisive move above 7308 which is Monday’s high and this would mark a turnaround in sentiment, especially if seen on a closing basis. The next resistance is not until 7428. The importance of support at 7220/7227 is growing.
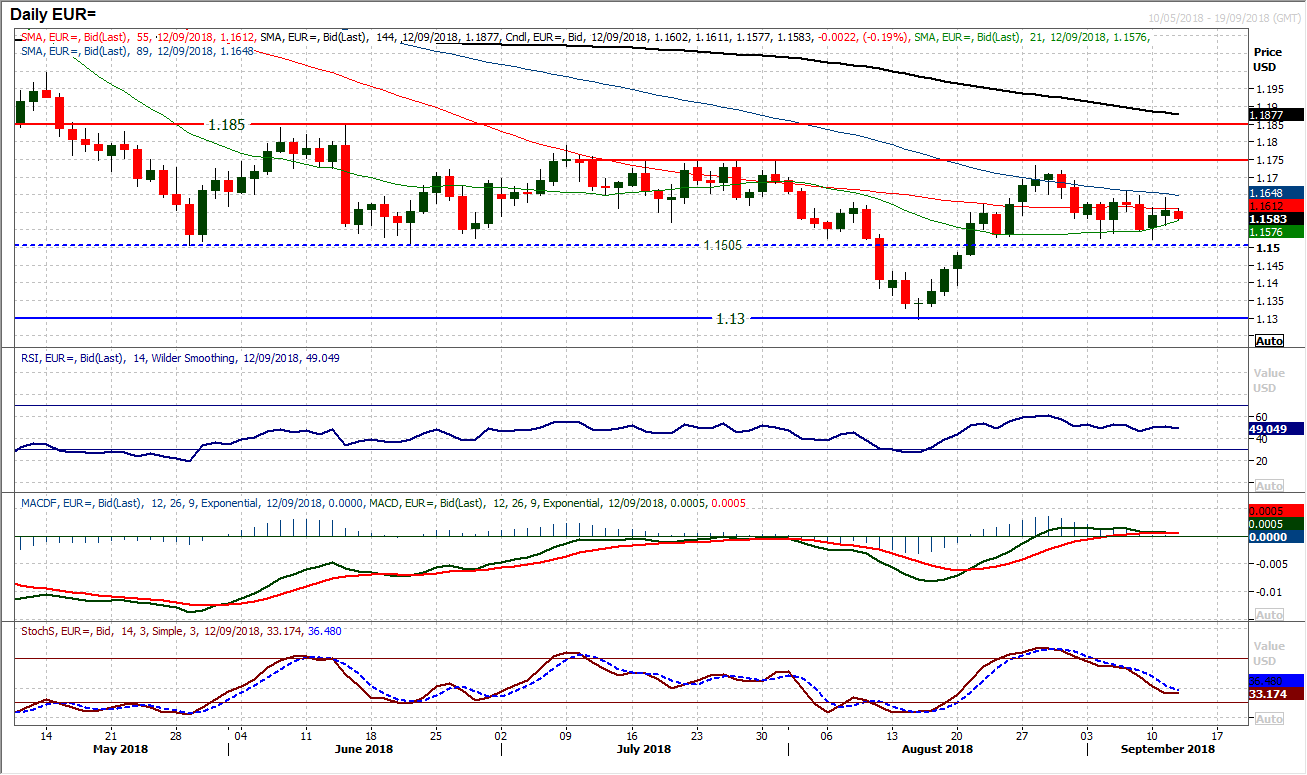
EUR/USD
The lack of direction on the pair continues as the consolidation above the support band $1.1505/$1.1530 has an ongoing neutralising effect on the outlook. The 55 day moving average has now been almost entirely flat for two weeks as the 21 and 89 day moving averages also converge. Momentum indicator are also giving little, with the RSI and MACD lines almost entirely neutral, whilst the Stochastics are possibly the only significant indicator that hints at a mild negative bias. Yesterday’s failure to push back above initial resistance at $1.1650 also hints at this mild negative bias, with the market ticking mildly lower again today. There is though little discernible indication on the hourly chart either and we wait still for direction. That would come on the negative side with a close under $1.1505. Above $1.1650 helps the bulls but resistance at $1.1745 remains key on a near to medium term basis.
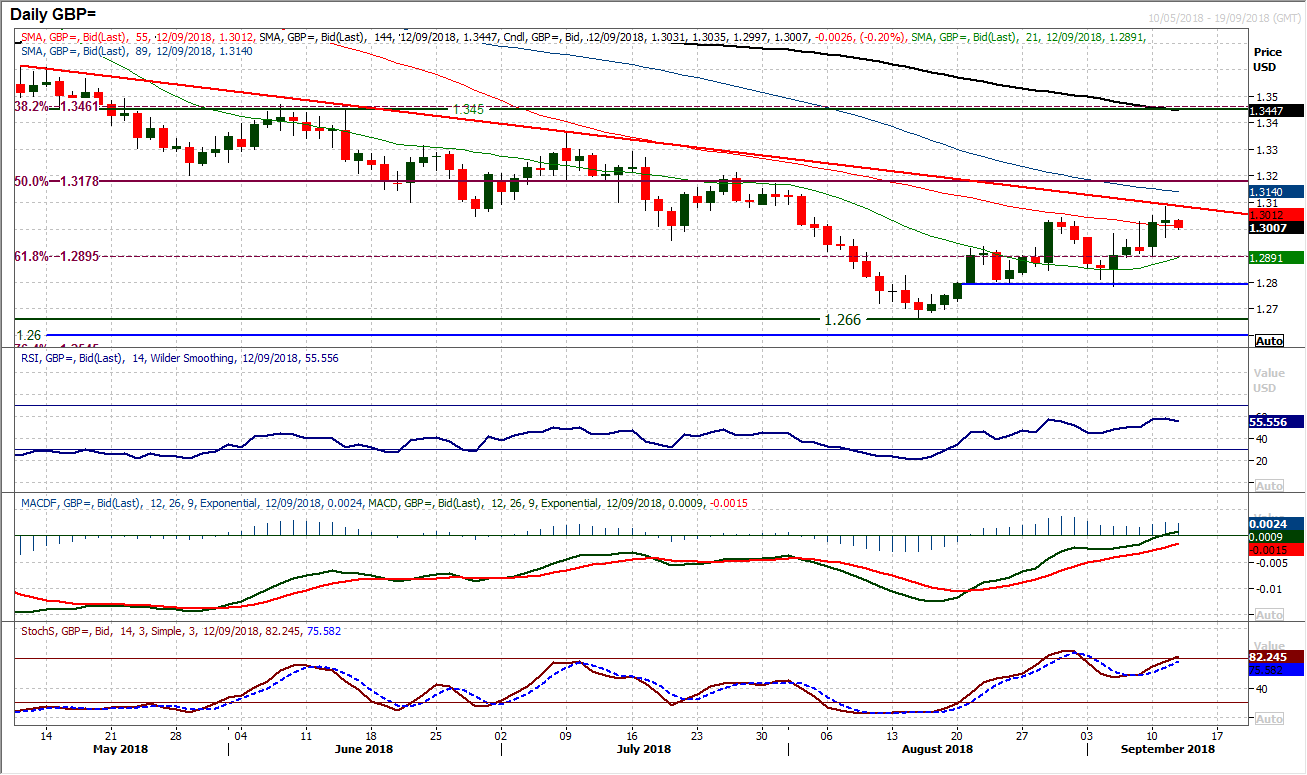
GBP/USD
There is a sense that the sterling bulls are trying hard to gain the ascendancy but they are being restrained. A break above the August high of $1.3045 means that Cable is now posting higher lows and higher highs in the past four weeks and the outlook is improving. However the buyers cannot break the shackles for a decisive bull breakout. The resistance of a shallow five month downtrend was tested yesterday, coming in at $1.3090 but remains intact as an overhead barrier to gains. However a move back above the psychological $1.3000 is a step in the right direction and the next resistance is $1.3170/$1.3215. Momentum indicators are also moving into far more positive configuration now. A move on the RSI above 60 and MACD lines above neutral would be a sign that the bulls are gaining control. Corrections are now a chance to buy, with daily chart showing support key at $1.2800 and then $1.2900/$1.2950 whih is a near term buy zone.
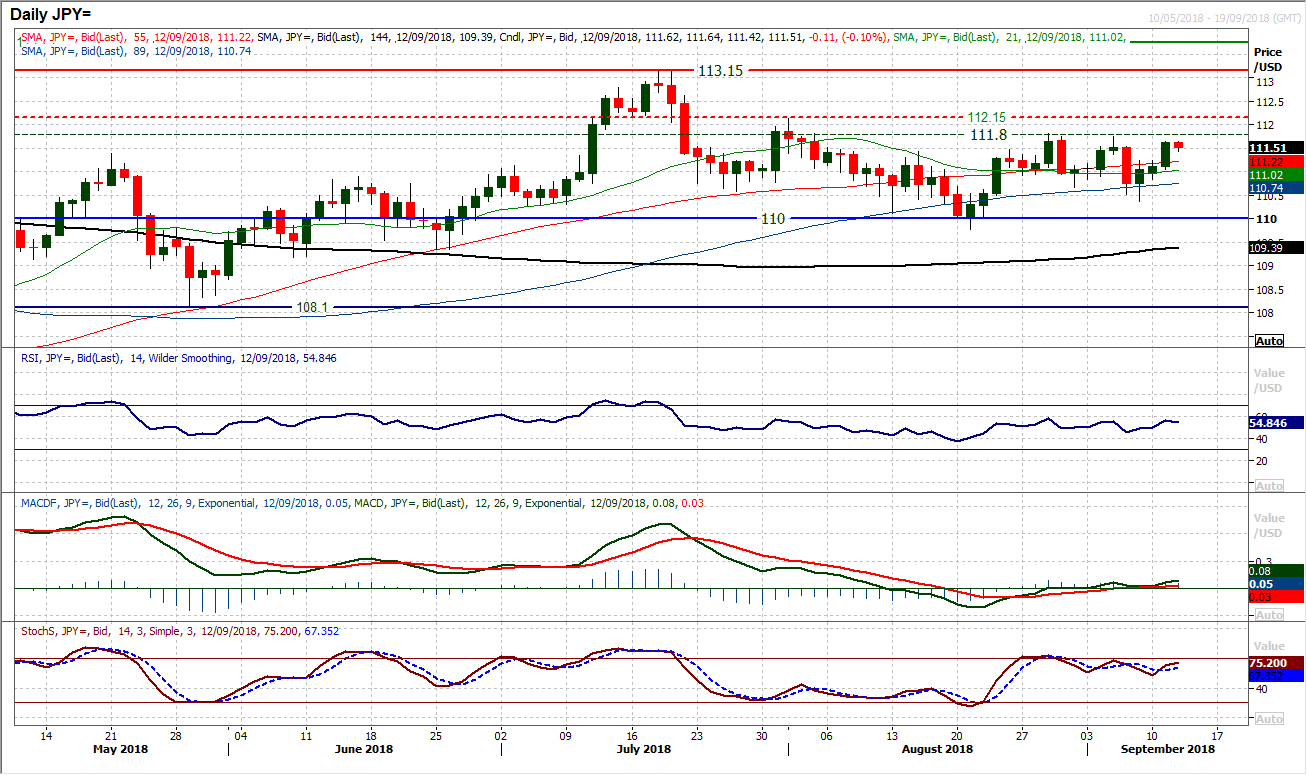
USD/JPY
A strong reaction from the dollar bulls early this week has taken the market back above 111.00 to eye a test of the key near to medium term resistance band 111.80/112.15. Can this move be sustained now to form a fourth bull candle, something that has not been achieved since the July strong bull move higher. The early move back today is not a great start and there is a concern on the hourly chart that the move may be beginning to struggle. The daily momentum indicators are ticking with a very mild positive bias, but as yet are not calling for a decisive upside break. This suggests that there may need a catalyst. There is initial support at 111.25 but a failure below 111.00 would now be another disappointment for those looking for decisive direction.
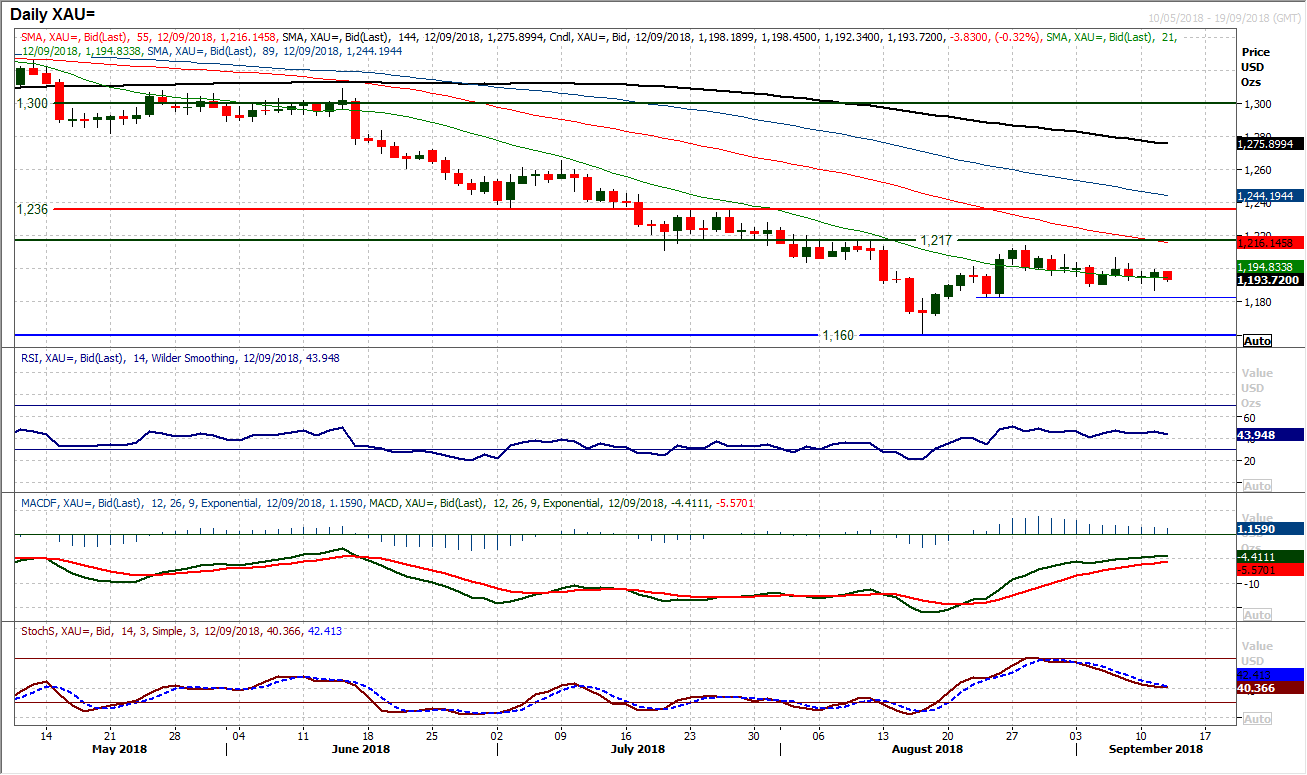
Gold
There is a mild bearish drift lower on gold which is pulling on the price, however, the intraday reaction to a breach of the initial support at $1189 was an interesting show of fight from the bulls. Since the rebound topped out at $1217 in late August there has been a notable drift lower on gold back below $1200 (which is now becoming a basis of resistance again). However, yesterday’s move saw the market post a decent positive reaction to bounce $10 off what is now the near term support at $1187. There is still a feeling that whilst the support of the higher low at $1183 remains intact, the prospects of a recovery will grow. The hourly chart shows this very mild negative bias in the drift lower but, again, selling pressure is not overpowering the market lower. Despite this though, the overhead supply is growing, with $1207 and now a stretch of three sessions under $1200. A breach of $1183 opens $1160.
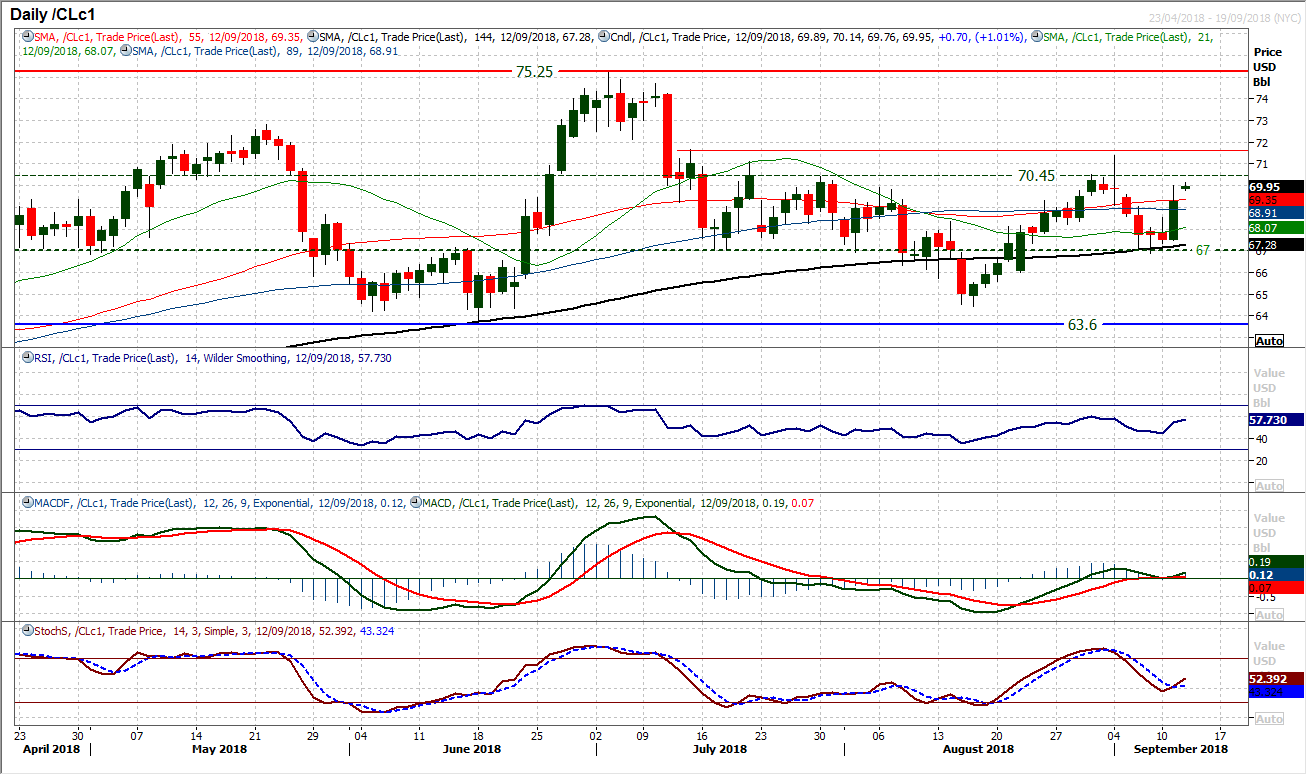
WTI Oil
With Hurricane Florence hitting the US east coast, there has been a sharp jump on WTI (on fundamental factors of increased demand in stockpiling) . Technically, a strong bull candle has put an end to six days of correction and once more the pivot at $67.00 has played a key role. The concern is that once the hurricane subsides (and these events tend to be over priced) then the market strength will likely subside and the move retrace. However, for now though, the bulls are running higher. This is helping momentum indicators tick higher again and the resistance at $70.45 /$71.40 is open again. The hourly chart shows $68.50/$69.00 is supportive initially.
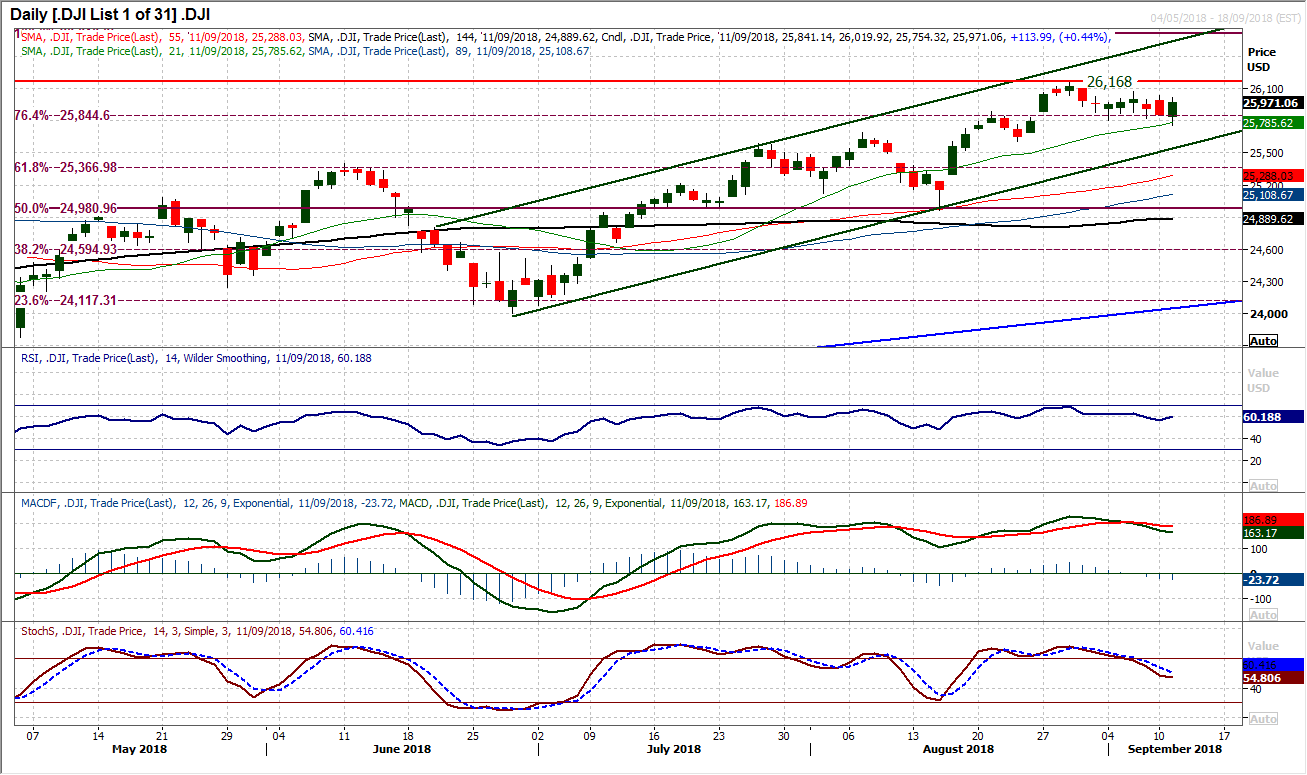
Dow Jones Industrial Average
The market has spent the past week consolidating around the 76.4% Fibonacci retracement at 25,845. It had looked on Monday as though the creaking support was ready to give way with a strong bear candle, but the market then followed this up with a contradictory strong bull candle on Tuesday which all but cancelled out the negative implications of the previous session. The rally candle also included a false downside break of 25,806 only to rebound from 25,754. The bulls now need to build on this move today with further gains through 26,074 initial resistance. This would open 26,168 again and have the bulls on their way again. The hourly chart shows that the shackles are though still on the market as there was a mild drift into the close and hourly momentum remains somewhat stunted. The bulls are not in control yet.
Author

Richard Perry
Independent Analyst


