Why US GDP is routinely understated
Gross Domestic Product is understated by 0.75% every year while inflation is overstated by 0.4%. This is the conclusion of our major new report, in collaboration with John Calverley of Calverley Economic Advisors, which argues that a mis-measurement of the digital sector is distorting our view of the world.

A digital remix
GDP is the revered measure of the size, and success, of national economies. Although it is commonly thought of as reliable and objective, it is a complex statistic with a history of errors, controversies and changing methods and definitions. In seeking to ‘remaster' GDP, we examine ways of fine-tuning its composition. We pay particular attention to the impact of the rapid digitalisation of the economy that has been gathering momentum over the past 25 years. Pursuing the music analogy, our focus is on a digital remix of GDP.
On conservative assumptions, we believe:
Official data understates US GDP growth by 0.75% per annum and overstates inflation by 0.4% due to inadequate measurement of the digital economy and the exclusion of investment in certain intangibles.
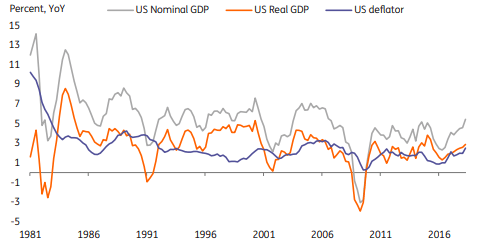
Growth in US nominal GDP, real GDP and inflation since 1980
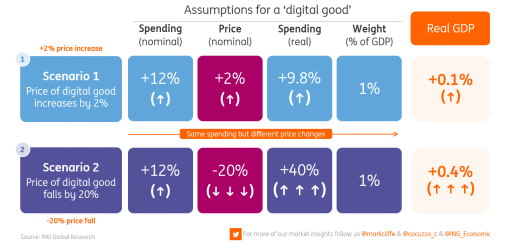
We calculate the under-measurement of the digital sector to be about 0.5% of GDP annually, which arises because of rapid price declines, the plethora of new goods and services and the extent of free goods. The improvement in quality is significantly under-measured so that output is understated and inflation overstated.
What happens to real GDP if the price of a digital good falls by 20%?
Mis-measurement of the digital sector may go back 30 years or more but is likely an increasing problem as it becomes more pervasive in the economy.
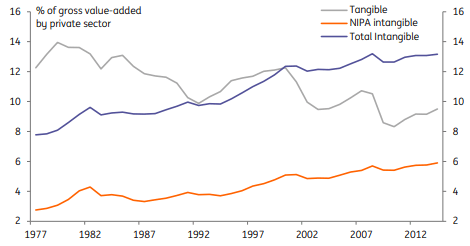
Correctly accounting for all intangibles by including them as investment would add 0.25% to GDP annually. Intangibles still left out by US statisticians include investment in brands, some types of intellectual capital, training, and the value of a firm's organisation and structure.
Tangible and intangible investment as % of total value added by US private sector, 1977-2014
The under-measurement of GDP is probably even greater than the 0.75% p.a. we claim, perhaps 1% annually or even as much as 2% because of the growing importance of services in general, where the calculation of quality improvements is much harder than for manufacturers.
The changing composition of US GDP
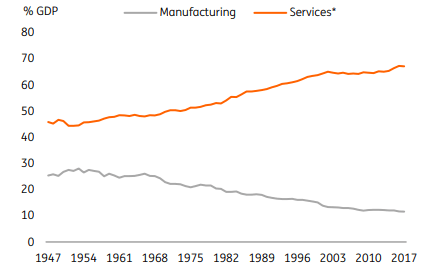
US trend growth has slowed by about 1.1% p.a. since 2004, according to official figures. As much as half of this may be explained by mis-measurement in the digital sector and intangibles. However, not all of the slowdown can be explained in this way because some of the mis-measurement we find occurred prior to 2004.
Why it matters
Official statistics suggest that productivity and trend GDP growth have slowed in the last decade and we are told that median living standards are little higher than 10 years ago in many advanced countries or even 20 or 30 years ago in the US. Our report casts doubt on these assumptions, arguing that the data is overly pessimistic. Contrary to popular belief, we suggest that living standards are not stagnant but are, in fact, still rising.
The digital era has exposed, more than ever, the limits of GDP as a measure of welfare. And if it is true that ‘you manage what you measure', as the old adage suggests, these GDP flaws raise troubling questions about government policy and economic decisions, which are liable to be distorted as a result.
Author

Mark Cliffe
ING Economic and Financial Analysis
Mark Cliffe is Chief Economist and Head of Global Research of the ING Group. Based in London and Amsterdam, he leads a team of economists and strategists in 14 offices around the world.


