Why the sell-off was overreaction

Risk-off is the name of the trade today. Investors are tensed due to the fear of a prolonged economic slowdown due to the outbreak of Coronavirus was anticipated. In reality, it was nothing more than the market participants overreacting to news of the virus spreading. This slowdown was indeed expected and, If investors thought that the virus wasn't going to spread or wasn't going to cause some minor shocks to the global economic growth, then yesterday certainly was an awakening call for them.
Overall, I do not see any significant reason as to why the Dow Jones should plunge over 1000 points, as there is nothing new about the on-going virus. The fact is that the way investors were acting yesterday made the situation look like a pandemic.
The Dow Jones plunged over 1,000 points or nearly 3.56%, the S&P500 fell 3.3.5%, and the NASDAQ index took the losing crown, it dropped nearly 3.71%.
So, the question remains: Should investors consider the current sell-off as an opportunity?
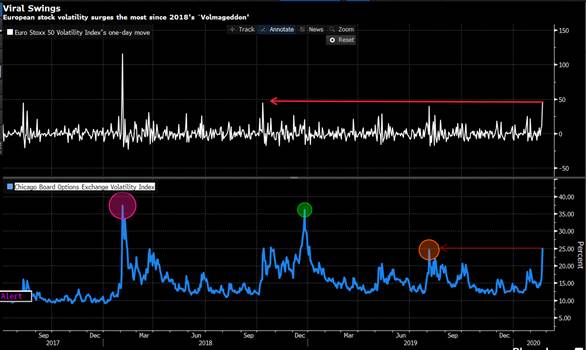
Well, before we answer this question, it is imperative to look at the price action of the risk-off instruments such as the volatility index and gold. The VIX index jumped over 46% yesterday, and it crossed above the 25 mark for the first time since April 2019. The European equity volatility also surged yesterday; the Euro Stoxx 50 volatility index added as much as 47%.
The fact is, nothing significant occurred yesterday, which caused both of these indices to surge the way that they did. In reality, the actual fear number for the VIX index starts after the 35 mark. We have seen the VIX index surging to the level of 25 (approx.) back in August last year but, after that, the price retraced. The actual spikes that took the price out of the 35 mark, happened in December and February 2018. Those were the kind of spikes that shook investors' confidence. The below chart shows these points
As for the gold price, we didn't see much strength in the price action. In fact, on a daily time frame, we can see the candle chart forming a bearish candle, meaning the momentum wasn't there at all and the closing price was very close to the opening price. Gold price surged too fast – not a good sign. Hence, today we are not seeing any upward move. I think it is likely for the gold price to retrace a little or consolidate before the upward momentum takes off again.
The bottom line is that yesterday's sell-off was nothing more than market participants overreacting. To answer the above question, if the S&P500 index crosses back above the 50-day moving average on a daily time frame, then this could be the opportunity that investors have been waiting for. However, if the price fails to cross above the 50-day SMA, then it is likely for the price to touch the 100-day SMA.
Author

Naeem Aslam
Zaye Capital Markets
Based in London, Naeem Aslam is the co-founder of CompareBroker.io and is well-known on financial TV with regular contributions on Bloomberg, CNBC, BBC, Fox Business, France24, Sky News, Al Jazeera and many other tier-one media across the globe.















