Why is Gold defying gravity?

-
Gold stays in rally mode, even when dollar and yields rise.
-
Central banks and geopolitics among the main drivers.
-
Chinese demand and inflation hedging add extra support.
Is it a bird? Is it a plane? No, it’s Gold
Gold entered a flying mode at the beginning of March, surpassing its previous record high of $2,135 hit on March 7. The metal consolidated only for a while thereafter before rallying again during the last days of the month to continue conquering uncharted territory. And all this even during periods when the dollar and Treasury yields were rising on the back of easing bets about Fed rate cuts.
From pricing in around 160bps worth of reductions at the turn of the year, the market now believes that by December, Fed officials will lower borrowing costs by only around 70 basis points, even fewer than the Fed’s projection of 75.
This was the result of stickier-than-expected inflation and data pointing to solid economic performance in the US.
What are the buying forces?
But why did gold traders remain indifferent to such developments? Why has the inverse correlation of gold with the dollar and yields broken down?
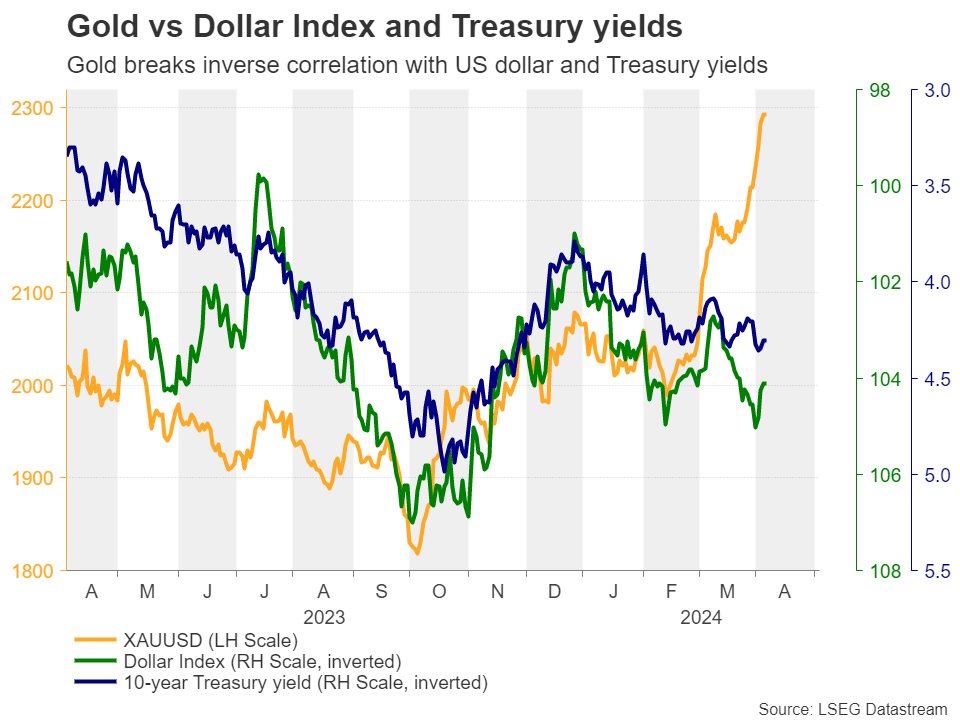
The fact that gold did not materially slide between December and February, when the dollar was outperforming all its major counterparts, suggests that there are other forces keeping the precious metal supported.
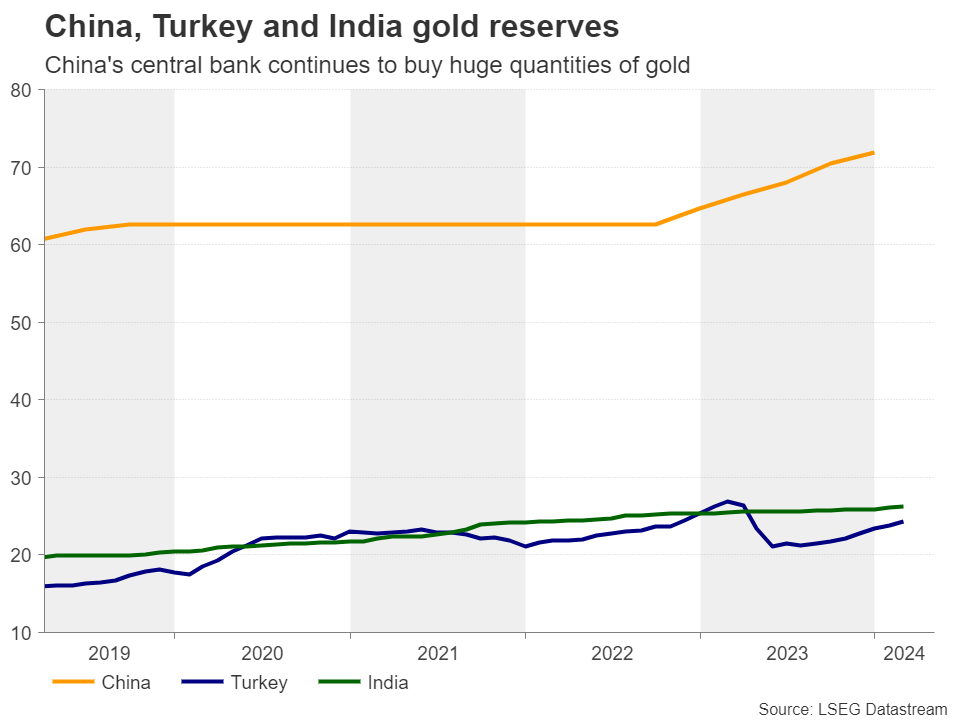
Central bank purchases
One may be the continued purchases by central banks, with the frontrunners being China, Turkey, and India. Although the latest publicly available data is for February points to a notable slowdown in central bank buying from January, those three central banks continued their purchases at an elevated pace, with China holding a long distance from the other two. Whether the overall central bank buying accelerated during March, when the precious metal skyrocketed, will be confirmed in the first few days of May.
Safe-haven flows
The geopolitical uncertainty may also be a reason for investors to canalize flows into gold. The Israeli strikes on the Iranian consulate in Syria with Iran promising payback, as well as Ukraine’s attacks on Russia’s oil infrastructures, are far from suggesting that the conflicts are nearing resolution. And with the yen staying wounded even after the BoJ’s decision to lift interest rates, gold may be the only safe haven in town.
Chinese demand
Traditionally, India is also a helping hand during the first few months of the year, as demand in the world’s second largest consumer for the precious metal increases due to the wedding season. However, as gold prices already hit a record in December, demand was dampened this year, with India’s imports likely plunging by more than 90% in March according to a government official.
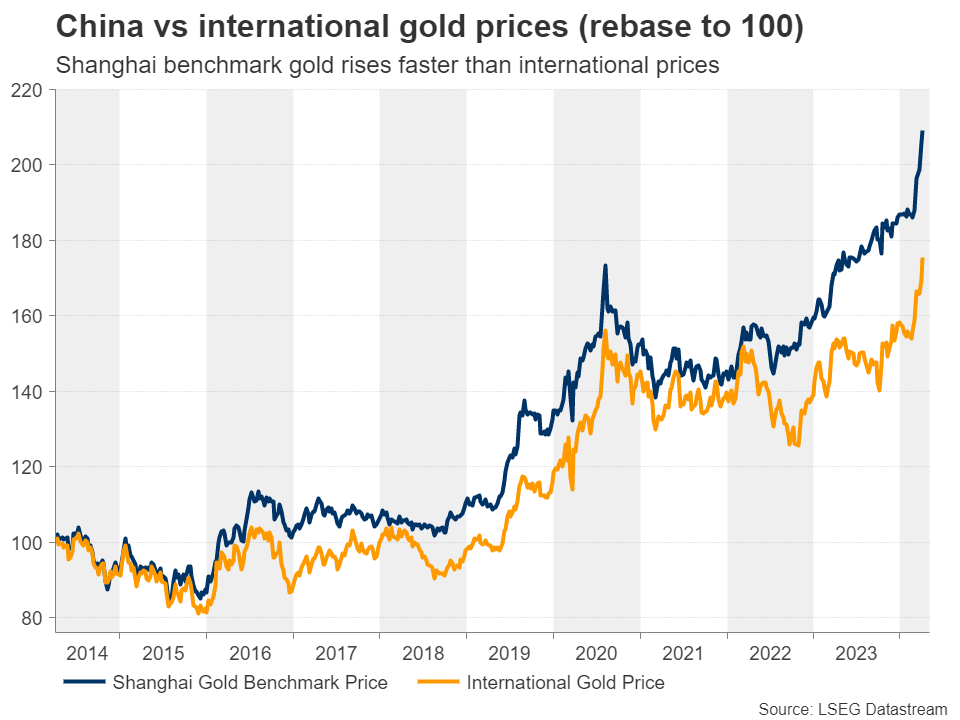
Considering that China and India account for more than half of total global gold demand, the yellow metal may be drawing bigger support from the world’s second-largest economy. With the Chinese stock market suffering and cryptos being banned there, the options for vehicles that local investors can profit from become very limited, and that’s maybe one of the reasons for increasing demand for gold. Indeed, the Shanghai benchmark gold price has been rising faster than international prices for the last couple of years.
Risk of Fed rate cut delay
As for expectations regarding the Fed’s future course of action, delayed rate cuts may not be much of a concern for gold investors whose horizons are likely longer than those of forex traders. The fact that the Fed’s next policy move is likely to be a cut may be more than enough, as it keeps the upside potential in Treasury yields limited. And with inflation data suggesting that prices in the US are stickier than previously expected lately, some participants may have viewed gold as a hedging vehicle against inflation for now.
Will the rally continue?
Moving ahead, the prospect of lower interest rates in the US, the elevated demand from China, and the uncertainty surrounding the geopolitical landscape are likely to keep gold supported for a while longer. With no prior highs or inside swing lows to mark potential resistance levels on the metal’s way higher, the next zone that could play such a role may be the 200% extension level of the May – October 2023 decline, at around $2,340. A break higher may encourage traders to aim for the psychological level of $2,500, which I the 261.8% Fibonacci extension level of the aforementioned slide.
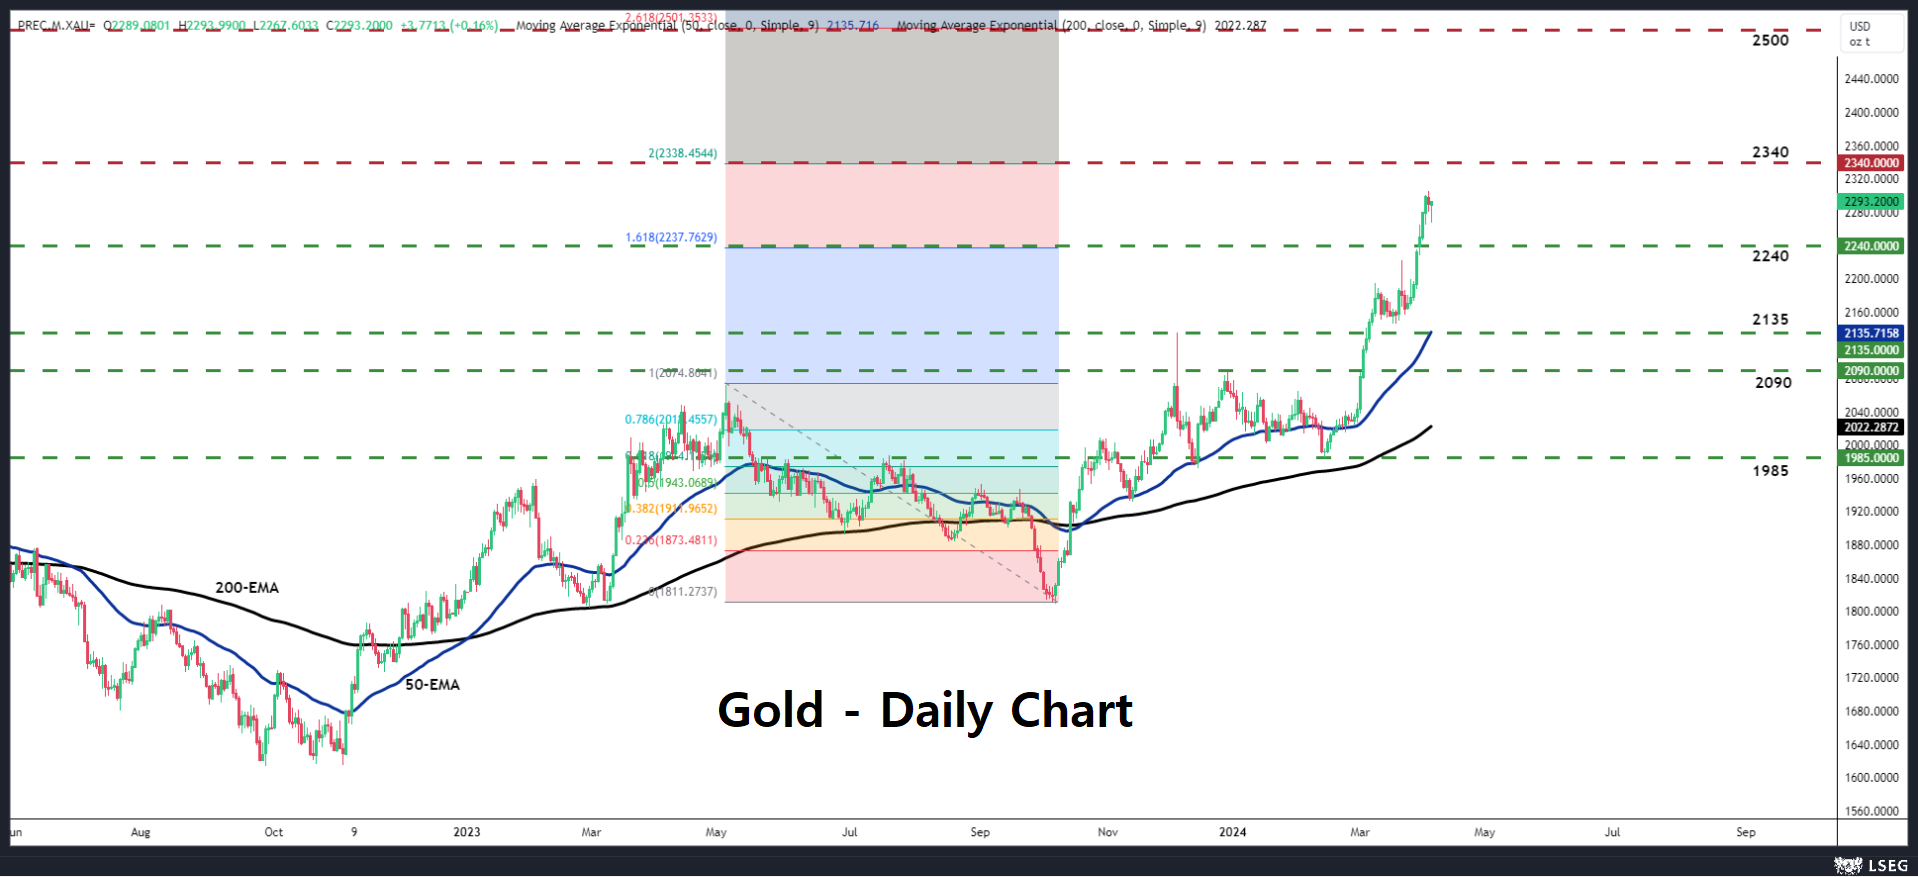
For the outlook to change
For the picture to darken, the precious metal may need to slide below $2,135, a level which now coincides with the 50-day exponential moving average (EMA). That said, for such a fall to materialize, some fundamental themes may need to change.
For example, the Chinese economy may need to improve to the point where local investors feel more confident to divert flows to the Chinese stock market. Or tensions between the world’s two largest economies – the US and China – may need to diminish, something that may prompt the PBoC (People’s Bank of China) to slow substantially its gold purchases. After all, the PBoC’s gold buying rampage is driven by a desire to weaken its dollar dependency. Other narratives that could weigh on gold may be the resolution of the geopolitical conflicts in the Middle East and Ukraine, or a fading out of all the basis points worth of Fed rate cuts for this year. Having said all that though, all these changes seem unlikely to happen anytime soon.
Author

Charalampos joined the XM Investment Research department in August 2022 as a senior investment analyst.


